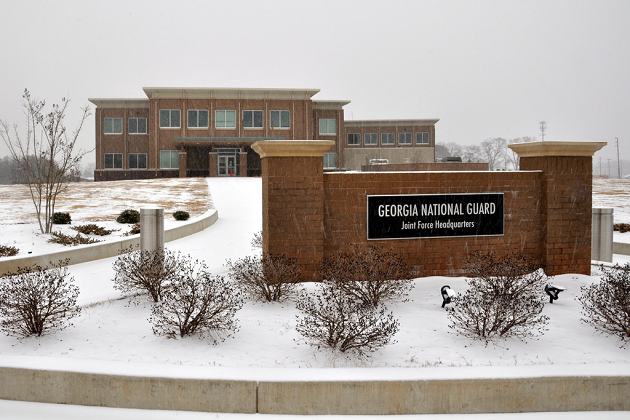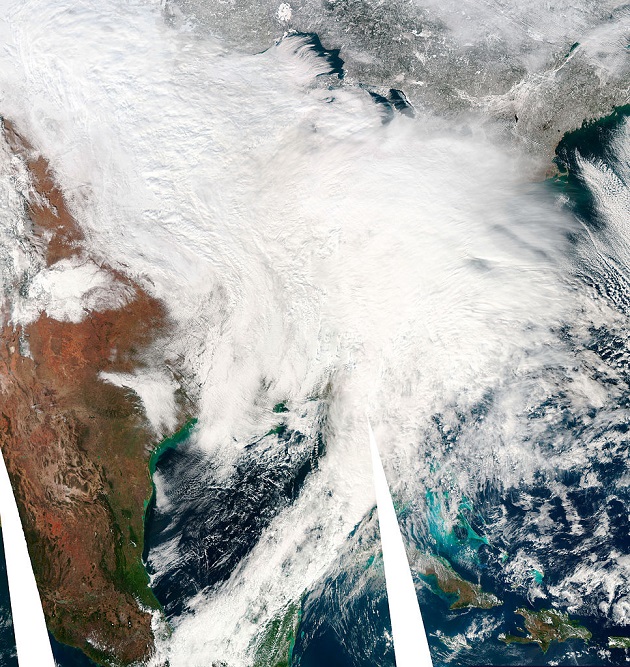
Snow in Georgia from Winter Storm Leon<a href="https://www.flickr.com/photos/ganatlguard/12195240396/sizes/l/">Georgia National Guard</a>/Flickr
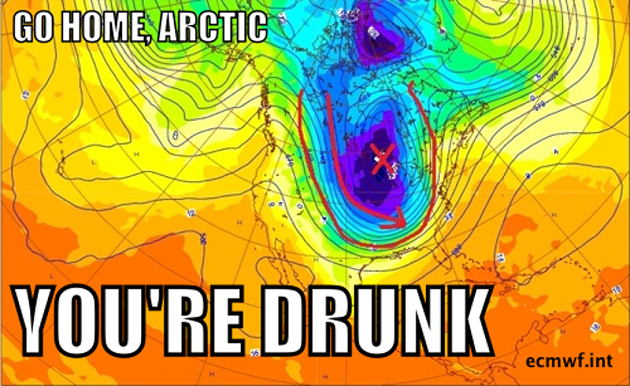
This week, the Central, Southern, and Eastern United States have all experienced yet another bout of frigid cold and snow, one that left motorists in the Atlanta area stranded in their cars overnight. Freezing air from the Arctic has been an all too frequent visitor this month, and with this latest arrival we’ve seen record-low daily temperatures for Detroit (minus-9 degrees), Grand Rapids, Michigan (minus-9 degrees), and Lubbock, Texas (7 degrees), among other locations, according to Weather Underground.
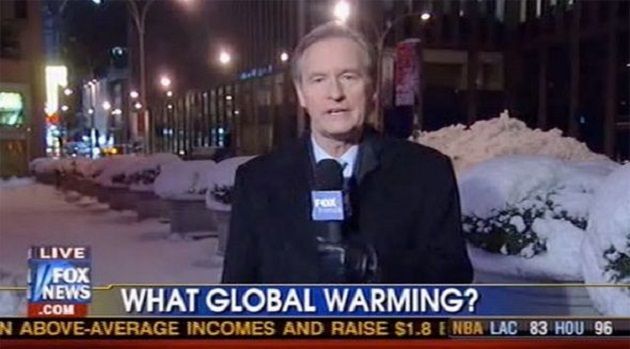
There’s no denying that it’s cold out; and once again, that’s prompting anecdotal claims that somehow, global warming is in question. Yet it’s important to bear in mind that just because you’re freezing—or even have seen a new daily record-low temperature in the particular place where you live—that doesn’t mean that what’s happening to you accurately reflects what’s happening to the planet overall, or even to the United States.
In other words, don’t be the white-capped guy in this XKCD comic:
So how do you avoid this particularly annoying kind of weather-induced cluelessness? Rather than thinking with your gut about cold temperatures, try thinking with your (or, science’s) statistics.
Consider: If global warming is not happening, then scientists say that the planet ought to be breaking just as many hot temperature records as cold temperature records overall. In a warming climate, however, you would naturally break more hot records than cold records over time. So what kind of climate do we live in?
According to data from the National Climatic Data Center (NCDC), the United States has set 1,347 daily low temperature records so far in January 2014, and tied another 304, for a total of 1,651. (A daily record refers to the highest or lowest temperature recorded in a particular place on a particular day of the year, as opposed to an all-time record, which is the highest or lowest temperature ever recorded in that place on any day.) When it comes to daily highs, by contrast, there have been only 489 new records and 237 tied records (many of them in the West and in Alaska), for a total of 726. (These records are updated regularly; our results are based on a search conducted yesterday evening.)
So based on just this month alone, record lows are indeed outpacing record highs. The data are clear: We’ve had a very cold month.
Yet if you zoom out and examine the long-term trend, things look different. In a 2009 paper in the journal Geophysical Research Letters, for instance, a team of climate and weather researchers analyzed the ratio of daily hot records to daily cold records from 1950 to 2006, with a careful sampling of overall weather station data. The result? They found that the ratio of hot records to cold records has been rising since the 1970s, and by the 2000s stood at about 2-to-1. That’s precisely what you’d expect to see if global warming is happening. Here’s a visualization of their results:

That study only runs through 2006, however. So can we bring it up to date?
The Weather Channel’s Guy Walton, a coauthor on the paper cited above, keeps a regular tally of NCDC weather records, and emails out his compilation to interested parties. One limitation is that according to Walton, this approach does not control for different weather station ages or other complicating factors. In other words, these data are not as carefully scrubbed as those used in the peer-reviewed study above. Nonetheless, based on Walton’s latest analysis of the data, the decade of the 2000s saw 312,746 daily record highs, compared with only 156,494 daily record lows, for a roughly 2-1 ratio overall. And if you consider the 2010s so far, Walton’s data show 91,383 daily record highs, compared with only 38,881 record lows, for a ratio that is well over 2-to-1.
So in sum: January has been a cold month for the United States. But it’s not reflective of the recent past, nor of what’s expected over the long term.


