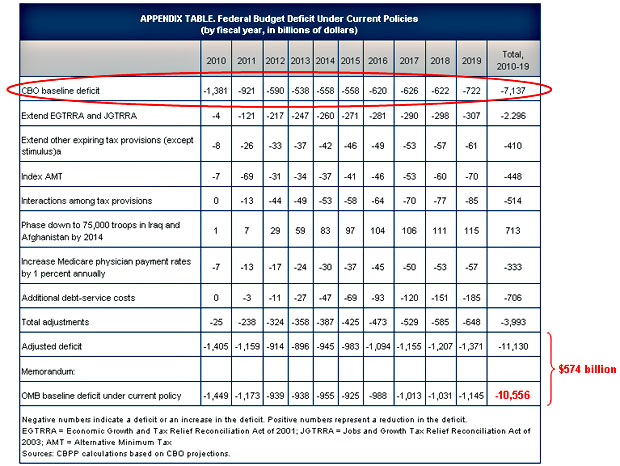
OK, it’s not really a chart. It’s a table. But it comes from CBPP and it takes a closer look at the recent headlines screaming that deficit projections have risen from $7 trillion to $9 trillion. Long story short, it’s not true.
Here’s why. The lower number is from the CBO and relies on its “baseline” budget calculation. This is an estimate of what would happen if current law remains unchanged forever, and as such it bears little resemblance to reality. In reality, the Bush tax cuts aren’t going to disappear in 2011, Medicare reimbursements aren’t going to be suddenly slashed, and the Alternative Minimum Tax won’t be left alone to gobble up ever more income. As usual, the law will be changed to take care of all these things, just like it is every year.
So if you take a look at what the deficit would be under current real-life policies, and compare it to estimates under Obama’s proposed policies, what do you get? As the table below shows, the real-life deficit isn’t $7 trillion, it’s more like $11 trillion. And the Obama deficit isn’t $9 trillion, it’s about $10.5 trillion once adjustments are made so that it can be compared to CBO estimates on an apples-to-apples basis. So the bottom line is simple: properly accounted for, the deficit actually goes down when you compare Obama’s budget proposals to current policy, not up.
All the grisly details are here. Warning: not for the faint of heart.


