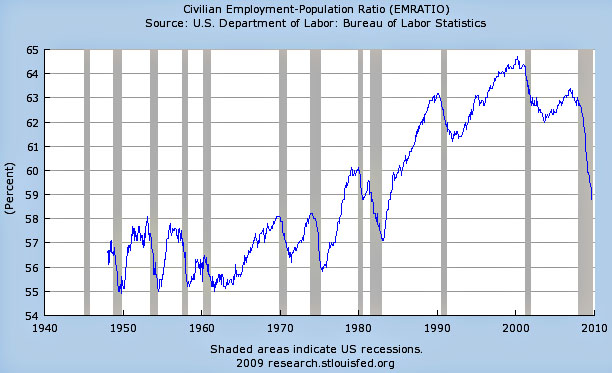
There are lots of different measures of unemployment. One of the best and most consistent is the civilian employment-population ratio, which shows the percentage of the workforce currently employed. The series below, from the St. Louis Fed, shows this measure for the past 60 years and it highlights just how bad our current recession is. Here’s the drop in the ratio in past recessions, measured in percentage points from peak to trough:
• 1948 — 2.2%
• 1953 — 3.1%
• 1958 — 2.5%
• 1960 — 1.4%
• 1969 — 1.9%
• 1974 — 2.4%
• 1979 — 3.0%
• 1990 — 2.0%
• 2000 — 2.7%
The worst recession of the past half century, the 1980-82 double dip, produced a drop of only 3.0 percentage points. I don’t think anybody has ever used the modifier “only” to describe that recession before, but it fits now: the current recession has produced a drop of 4.6 percentage points so far. That’s double the postwar average. The drop from the previous peak in 2000 is 5.9 percentage points. So far. The job scene is simply devastating right now. More from Andrew Samwick here and Brad DeLong here.


