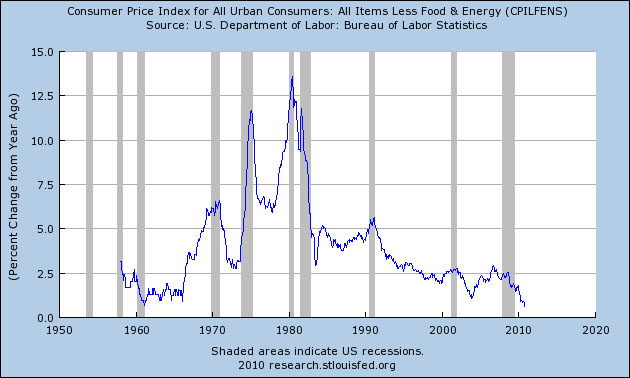
Paul Krugman points out today that core inflation is at its lowest level since recordkeeping began in 1957. But that’s a lot clearer in chart form, isn’t it? So here it is:

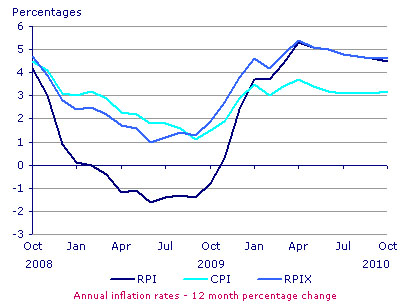
This, of course, explains the Fed’s quantitative easing program. For a variety of good reasons, the Fed primarily uses core inflation to measure price levels in the economy, and core inflation dropping to 0.6% has put the economy at risk. So we want more inflation, and we can get it with very little prospect of future trouble. For comparison, here’s a chart showing inflation in Great Britain recently:

The Bank of England is in a tricky position. It likely feels that prices haven’t risen more based on market belief in the Bank’s credibility, but each month that the Bank doesn’t clamp down on inflation that credibility erodes a bit. The Bank is reluctant to supress price increases just now, however, because of the substantial fiscal tightening that’s looming just over the horizon. On the one hand, this is a tricky position for a central bank to be in. On the other hand, it’s the rare rich world country that wouldn’t trade places with Britain. The last two quarters have produced surprisingly strong growth, giving both the Bank of England and the government more of a cushion to address other policy goals.
Tricky indeed, but take a look at the graph. When did inflation start rising in Britain? In the middle of 2009. And when did growth start surging? About two quarters later. Analysts claim that Britain is now “overshooting” its inflation target, but if this is the result of overshooting then maybe we could use a bit of the same ourselves?
Not everyone feels the same way, of course. The result has been a strange-bedfellow war against the Fed, described well today by Noam Scheiber. It’s yet another example of the rich enlisting the poor to support policies designed to safeguard the rich. So far they’ve been pretty successful.


