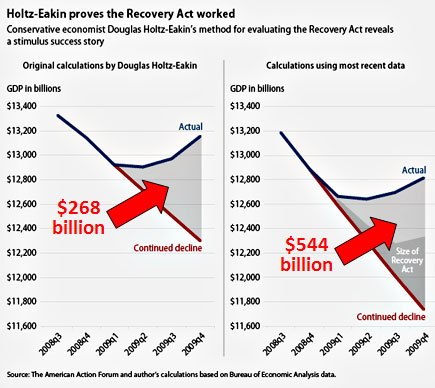
Conservative economist Douglas Holtz-Eakin has a chart he’s fond of that demonstrates just how ineffective the 2009 stimulus was. Basically, it shows that the stimulus cost $260 billion and produced only an extra $268 billion in GDP. Personally, I’d take even that, but his point is that the stimulus produced no Keynesian multiplier effect at all. It was just a 1:1 replacement of revenue from one source to another.
But as you may recall, the US Bureau of Economic Analysis recently revised its GDP estimates from late 2008 and 2009, and it turns out the economy was doing much worse than we thought. And if you don’t recall this, Michael Linden wants to remind you about it today. He also wants to remind Douglas Holtz-Eakin about it. Because it turns out that when you redo Holtz-Eakin’s favorite chart using the corrected data, it suggests that the stimulus bill produced about $544 billion in extra GDP. In other words, a multiplier effect of about 2x.

I suppose there are two ways to respond to this. Holtz-Eakin could admit that he was wrong. Or he could invent a reason that his old chart is no good and then scurry back to his computer to produce a brand new chart using a different methodology that, once again, shows that the stimulus didn’t work. We’ll see which way he chooses.


