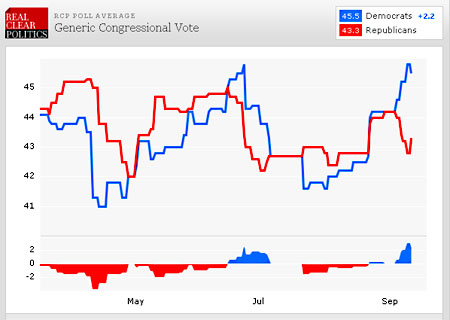
Yesterday I asked whether the results of generic congressional polling were a good predictor of the actual national House vote. I was skeptical because conventional wisdom says that Republicans usually outperform the generic ballot. Today, Sam Wang produces the following historical numbers from Real Clear Politics:
2010 Polling average, R+9.4%. Outcome: R+6.6%. [R delta = -2.8%]
2008 Polling average, D+9.0%. Outcome: D+10.9%. [R delta = -1.9%]
2006 Polling average, D+11.5%. Outcome: D+7.9%. [R delta = 3.6%]
2004 Polling average, tie. Outcome: R+2.6%. [R delta = 2.6%]
2002 Polling average, R+1.7%. Outcome: R+4.6%. [R delta = 2.9%]
“R delta” represents whether Republicans did better or worse than the generic ballot results, and it turns out that sometimes they do better and sometimes they do worse. I’ll toss out two comments. First, this shows that I may have been out of date. My belief that Republicans outperform the generic ballot was based on data through  2006, and in fact, Republicans did outperform the generic ballot in 2002-06. However, they’ve underperformed in the two most recent elections. So I need to update my priors.
Second, these results are for the final week of polling. It makes sense that the generic ballot would converge toward the actual national vote a few days before the election. But how about earlier? This is a little quick and dirty, but here are the average generic ballot results for the few days around September 1:
2010 Polling average, R+4.8%. Outcome: R+6.6%. [R delta = 1.8%]
2008 Polling average, D+8.4%. Outcome: D+10.9%. [R delta = -2.5%]
2006 Polling average, D+11.3%. Outcome: D+7.9%. [R delta = 3.4%]
2004 Polling average, D+0.7%. Outcome: R+2.6%. [R delta = 3.3%]
2002 Polling average, R+2.0%. Outcome: R+4.6%. [R delta = 2.6%]
It looks to me that a couple of months out, the generic ballot really does underweight how well Republicans will do. The only exception is 2008, which turned into a Democratic landslide. So I’d probably subtract two or three points from the current RCP generic poll average, which has Democrats ahead by 2.2%. In reality, this probably suggests that Republicans will win the national vote by a point or a bit less, and given their incumbency advantage, that might translate into a one or two-point lead in actual number of seats won.
This is very, very rough. Consider it extremely tentative. I’d be pretty interested in a more rigorous look at this if anyone wants to do it.
UPDATE: Why did I choose September 1? Because I’m an idiot and forgot what month it is. October 1 would have been better, or even September 21 if I wanted to use today’s results. In any case, my interest in a more rigorous analysis stands. Mid or late-September would probably be a better comparison point, though.


