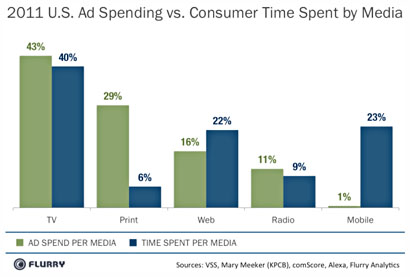
 Ezra Klein directs our attention today to the chart on the right, from a mobile analytics company called Flurry. Their basic story is simple: the blue bars show how much of our media consumption time is spent on various platforms (TV gets 40% of our time, print gets 6% of our time, etc.), while the green bars show how much money advertisers spend on these platforms. The verdict is clear: mobile devices command 23% of our time but are getting only 1% of the advertising dollars.
Now, this data comes from a company that has a vested interest in hyping the mobile audience, so obviously you want to take it with a grain of salt. By way of comparison, Josh Marshall recently told us that TPM gets about 20% of its hits from mobile devices, and this is from an audience that’s very tech savvy and very mobile-friendly. But if it’s only 20% for TPM, the number for the population-at-large isn’t likely to be more than 10%. Or maybe even 5%.
(Of course, there’s a difference between hits and time spent. Maybe mobile users spend a lot more time per visit than web users or radio listeners. But I’d need to see some evidence for that.)
In any case, clicking through to various links, it appears that there are about 100 million smartphone users in the United States and they spend about an hour a day on various apps (that’s not including phone, text, and email). Of that, about 80% of the time is spent on games and social networking. So even if the mobile market isn’t quite as large as Flurry would like us to believe, it’s a pretty big and growing market any way you slice it.
But now I’m curious: How much time do you spend with your mobile phone? And what do you spend that time doing?


