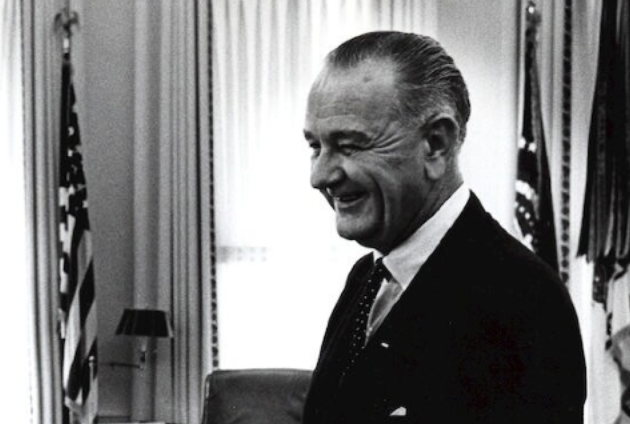
President Lyndon B. Johnson.<a href="http://www.loc.gov/item/ihas.200197146">Library of Congress</a>
President Lyndon B. Johnson announced a “war on poverty” in America in his State of the Union address on January 8, 1964. “This administration today, here and now, declares unconditional war on poverty in America,” he said. “It will not be a short or easy struggle, no single weapon or strategy will suffice, but we shall not rest until that war is won. The richest nation on Earth can afford to win it. We cannot afford to lose it.” The aim of the war, he said would be to “cure” and “prevent” poverty.
Johnson’s administration went on to design “Great Society” initiatives, including a permanent food stamp program, Medicare and Medicaid, Head Start, which provides early education to low-income kids, and increased funding to public schools.
The war on poverty helped raise millions above the poverty line. During Johnson’s years in office, the poverty rate dropped from 23 percent to 12 percent.
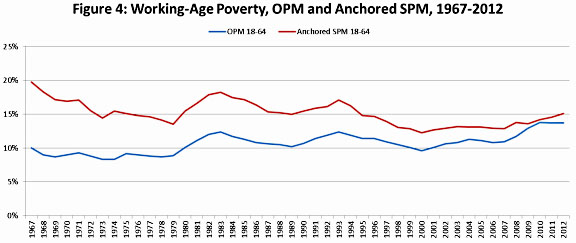
But where do we stand today? The government’s official measure of poverty shows that poverty has actually increased slightly since the Johnson administration, rising from 14.2 percent in 1967 to 15 percent in 2012.
But those numbers aren’t quite accurate, because while they factor in welfare and Social Security payments, for example, they don’t include additional non-cash government aid from safety net programs such as food stamps and housing assistance, and expenses like taxes and medical costs. A few years ago, the government started using a new, more accurate way to measure poverty that includes these factors, which shows that government programs did indeed slash poverty—from 19 percent to 16 percent—between 1967 and 2012. And last month, a group of researchers at Columbia University released a report using a similar adjusted poverty measure that takes into account both non-cash government assistance and expenses, as well as today’s standards of living. With these adjustments, the poverty rate dropped from nearly 26 percent to 16 percent over that same time period.So have we won the war on poverty? If it means that the lives of millions of Americans in poverty have improved under the Great Society programs, yes. But by no means have we attained Johnson’s goal of “curing” poverty. The poverty rates of certain demographic groups remain stagnant and racial disparities are as wide as ever. Check out the graphs below (based on the Columbia University measure):

The poverty rate for the elderly has fallen, as has child poverty. But as my colleague Kevin Drum noted last month, the working-age poverty rate has stayed flat for 40 years. It dropped from 20 percent in 1967 to about 15 percent in 1974, and remains there today.

The percent of Americans in deep poverty—those living on an income of less than $11,775 a year for a family of four—has hovered around 5 percent of the population for about 40 years.

Annually, $11,775 is not much. But try living on $2 a day, as Americans in more than 1.5 million households do. That number has jumped since 1996, when welfare reform kicked many families off of government assistance. (Note that when food stamps are included as income, the number of those living on $2 a day* decreases.)

Even though the portion of Americans in poverty has dropped, that doesn’t mean that those above the poverty line—$23,550 for a family of four—have enough money to live on. A recent study by the Economic Policy Institute (EPI) of 615 communities in the US found that in all of those localities it was impossible for two parents who earn the federal minimum wage—$30,000 a year total—to support a family of four. For instance, the EPI analysis found that the monthly costs associated with “an adequate standard of living” in St. Louis include $830 for housing, $754 for food, $959 for child care, $607 for transportation, $1,457 for healthcare, $405 for other necessities, and $377 in taxes, for a grand total of $5,389 a month. That’s far above the federal poverty line for a family of four, which is $1,962 a month. Here are the costs of living for a family of four in 13 cities across the United States, according to EPI:

The income disparity between white Americans and minorities remains stark. The current poverty rate for African Americans is 27.2 percent, and just 9.2 percent for white people. It’s 25.6 for Hispanics, and 11.7 percent for Asian Americans.

Charts by AJ Vicens and Jaeah Lee.
*Living on $2 per day refers to each person in the household, not the household altogether.


