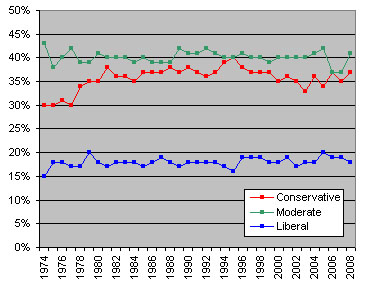
 Gallup released a poll on Monday showing a slight blip in the number of Americans who identify themselves as conservatives. Since this got a fair amount of attention, I figured it was time to update my chart of the Harris Poll version of this data, which goes back to the early 70s and consolidates the results from multiple polls throughout the year.
As you can see, nothing much has happened for the past three decades. In the mid-70s a bunch of “not sure” respondents decided they were conservatives after all, and since then the numbers have remained remarkably steady: about 18% identify as liberals, 37% as conservatives, and 40% as moderates. This hasn’t varied by more than three or four points since 1980. The most recent Harris data is for 2008, and breaks down 18% liberal, 37% conservative, and 41% moderate, right in line with the historical averages. It’s possible that something dramatic has happened since then, but Gallup aside, I wouldn’t count on it. Ten bucks says Harris gets pretty much the same results when they consolidate all the 2009 data at the end of the year.


