
A few weeks ago I promised an updated roundup of evidence about the link between lead poisoning and violent crime. Here it is.
It’s in three parts. Part 1 is the basic story. Part 2 is various bits of commentary explaining different details and predictions of the hypothesis. Part 3 is a roundup of all the lead-crime studies that have been done since 2012 that I’m aware of.
1. A Brief Summary of Lead and Crime
The lead-crime hypothesis is pretty simple: lead poisoning degrades the development of childhood brains in ways that increase aggression, reduce impulse control, and impair the executive functions that allow people to understand the consequences of their actions. Because of this, infants who are exposed to high levels of lead are more likely to commit violent crimes later in life. There are three types of research that confirm the connection between lead and crime:
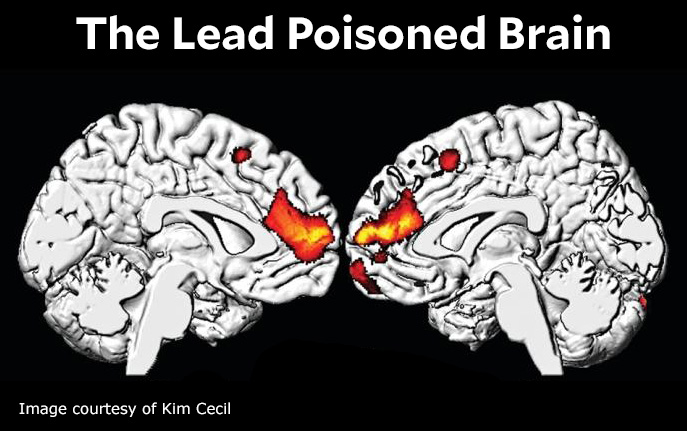
- Brain studies. Neurologists have performed MRI scans of adults who were exposed to lead as children. They’ve found that because lead is chemically similar to calcium, it displaces the calcium needed for normal brain development.
- Prospective studies. These are studies that begin in childhood and follow a group of children through adulthood. The children are measured along the way and their adult outcomes are catalogued. Several prospective studies have shown that children who are exposed to high levels of lead are more likely to be arrested and incarcerated for violent crimes later in life.
- Population studies. These are studies that depend on statistical analysis of groups, rather than individuals. Dozens of population studies have found strong correlations between the exposure of a group to lead and the level of violent crime committed by the group later in life. These groups can be neighborhoods, cities, states, or countries. For the USA, the correlation between lead and crime looks like this:
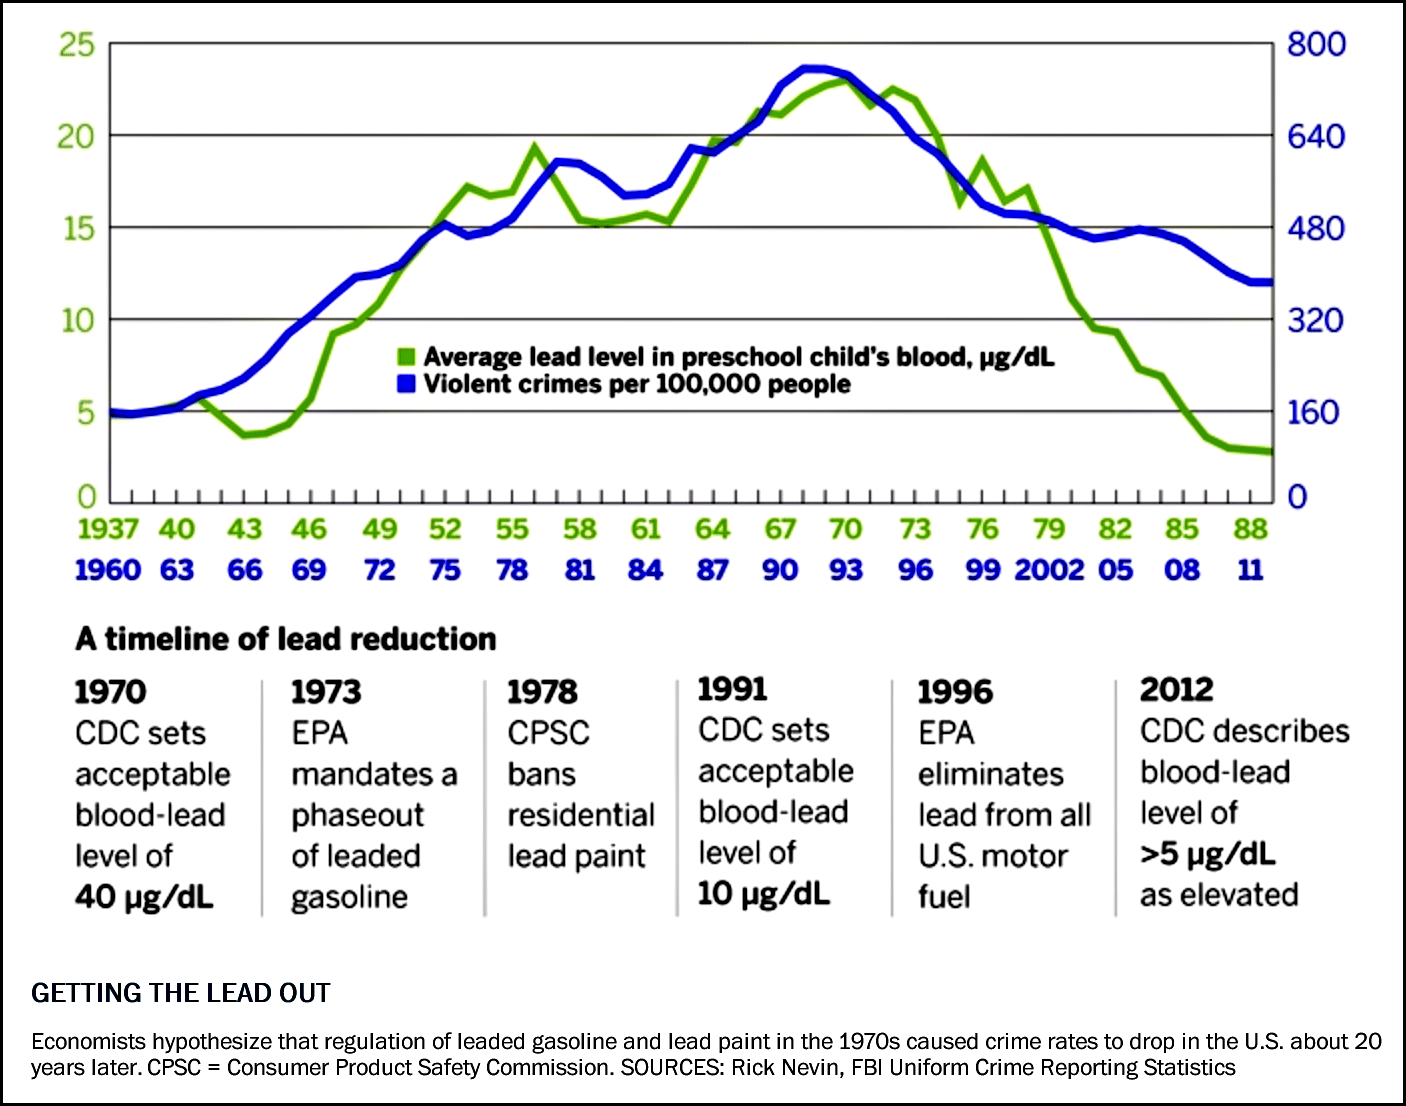
No single study is proof of the lead-crime hypothesis. However, the accumulated evidence for the hypothesis is pretty overwhelming. I outlined the case for the lead-crime hypothesis in 2012 in a magazine piece called: Lead: America’s Real Criminal Element.
In a nutshell, this article argues that atmospheric lead from gasoline tailpipes rose steadily after World War II, affecting babies born in the late 40s and beyond. The leading edge of this generation became teenagers in the late 60s and was more prone than previous generations to committing violent crime. Every year the population of teenagers with lead poisoning increased, and violent crime increased with it. This is why the 70s and 80s were eras in which crime skyrocketed.
In the early 70s the United States began to phase out leaded gasoline and newborns became steadily less lead poisoned. Like clockwork, as the leading edge of this generation became teenagers in the early 90s, the crime wave started to recede. By 2010, an entire generation of teenagers and young adults—the age group responsible for most crime—had grown up nearly lead free, and the violent crime rate had plummeted to half or less of its high point. This happened across the board: in big and small cities; among blacks and whites; in every state; in every city; and, as it turns out, in every other country that also phased out leaded gasoline.
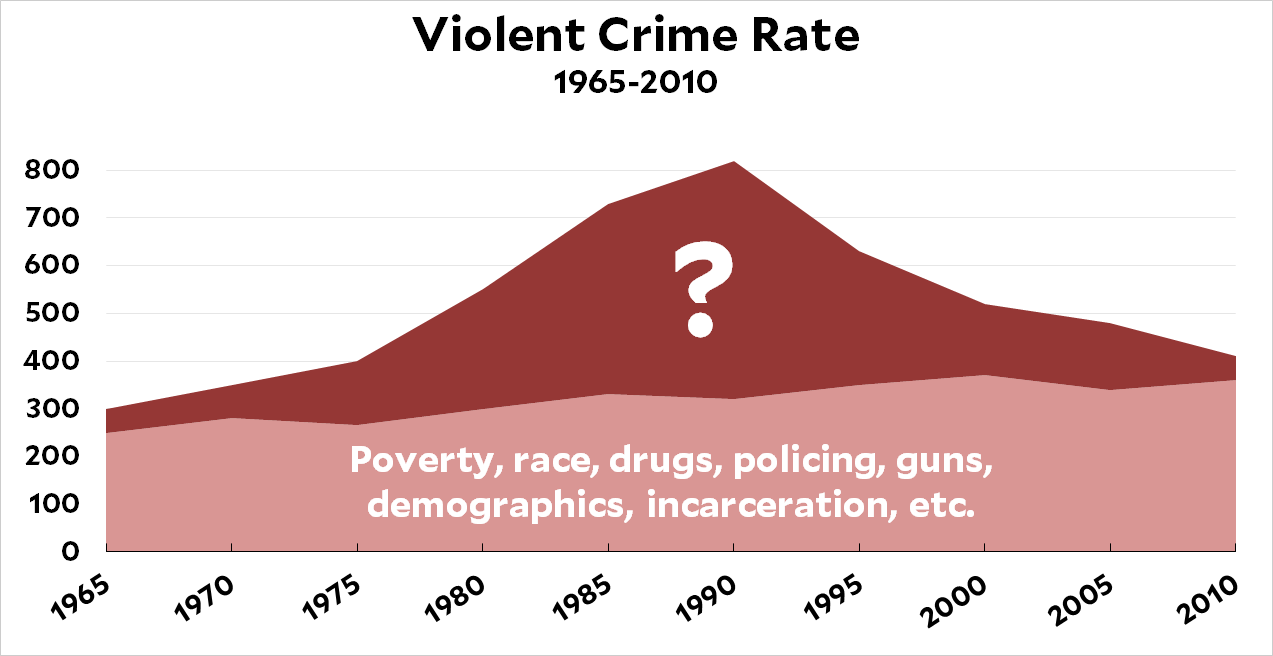
It’s important to emphasize that the lead-crime hypothesis doesn’t claim that lead is solely responsible for crime. It primarily explains only one thing: the huge rise in crime of the 70s and 80s and the equally huge—and completely unexpected—decline in crime of the 90s and aughts. The lead-crime hypothesis is the answer to the question mark in the stylized chart below:
Since I wrote my article in 2012, researchers have conducted nearly a dozen new studies designed to test the lead-crime hypothesis. All but one of them has supported it, and the single outlier has some serious methodological issues. The only real challenge remaining is from criminologists who examine, say, murder rates in the 80s and find that all age cohorts between 15 and 30 were equally violent. But if lead levels increased over time and therefore affected different age groups differently, shouldn’t we see differences in crime rates by age group too? Does this disprove the lead-crime hypothesis?
The biggest problem here is that no agency tracks crimes by the age of the perpetrator. The data just doesn’t exist. However, we can estimate it for murder because it’s well-known that murderers and their victims tend to be of similar ages. Unfortunately, the number of murders is relatively small compared to the universe of violent crime, which makes it statistically challenging to analyze. What’s more, the 80s are a decade in which virtually every age cohort from 15 to 30 was pretty severely lead poisoned.
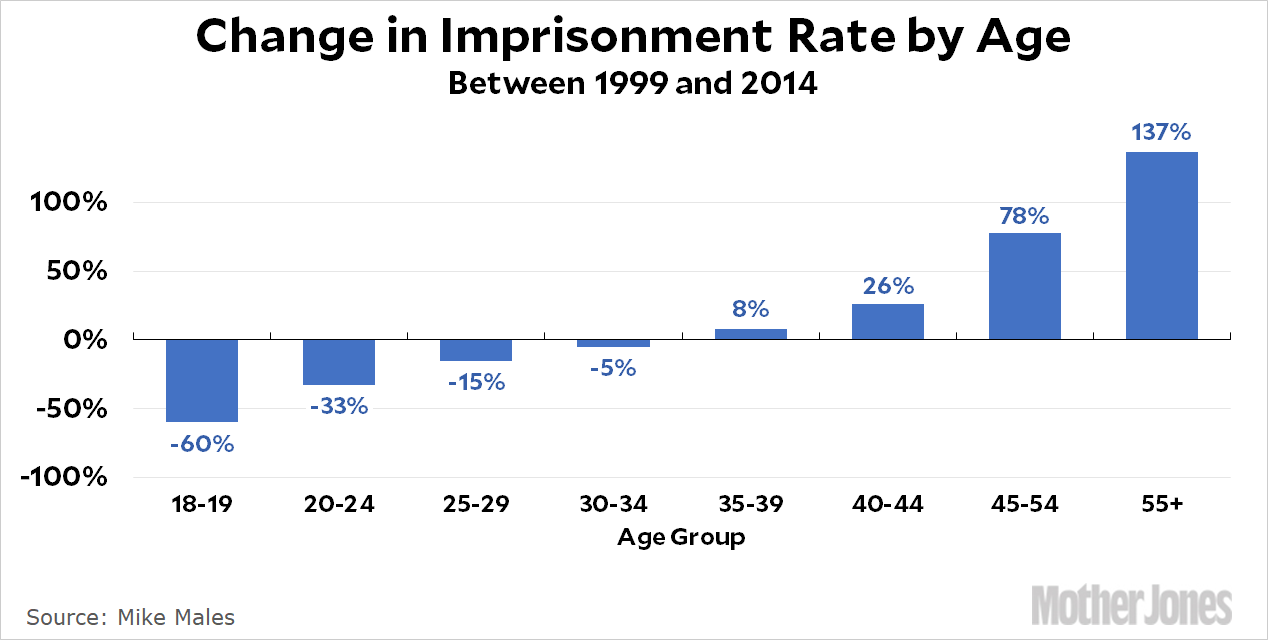
For this reason, cohort analysis based on murder rates in the 80s is unlikely to have the statistical power to tell us much. And since age data for other crimes and other eras doesn’t exist, we’ll never get anything better. However, in recent years we’ve gotten some new evidence: once crime began to decline, it was only a matter of time until incarceration began to decline too. That’s started to happen over the past decade, and of course we know the precise age of everyone in prison. What we’ve found is that incarceration rates are dropping almost precisely the way the lead hypothesis predicts: big drops for younger cohorts who are lead free these days, and smaller drops for older cohorts who are still part of Generation Lead. It appears that, in fact, violent crime almost certainly rose and fell by age cohort, just as it should have. There’s more on this below.
In my opinion, the lead-crime hypothesis is by now all but unassailable. The amount of direct research supporting it is massive, and there have even been a few studies done of lead in completely different contexts (lead paint, lead in water pipes) that support the hypothesis in different eras. What’s more, given what we know about how lead affects the brain, none of this should be surprising. What would be surprising is if a powerful neurotoxin like lead didn’t affect violent crime.
2. Commentary on Lead and Crime
The prison population is dropping. Declining exposure to lead starting in the mid-70s reduced the rate of violent crime 20 years later. Twenty years after that, as members of Generation Lead are being released from prison and aren’t being replaced, the prison population has finally started to drop too. The decline is most pronounced among younger cohorts, just as you’d expect from the lead-crime hypothesis.
Lead and murder. We have fairly good data on homicide rates going back for a century, and it turns out the United States has had two epidemics of murder, the first in the 20s and 30s and the second in the 70s and 80s. When you account for both lead paint and gasoline lead, it turns out that lead can explain them both.
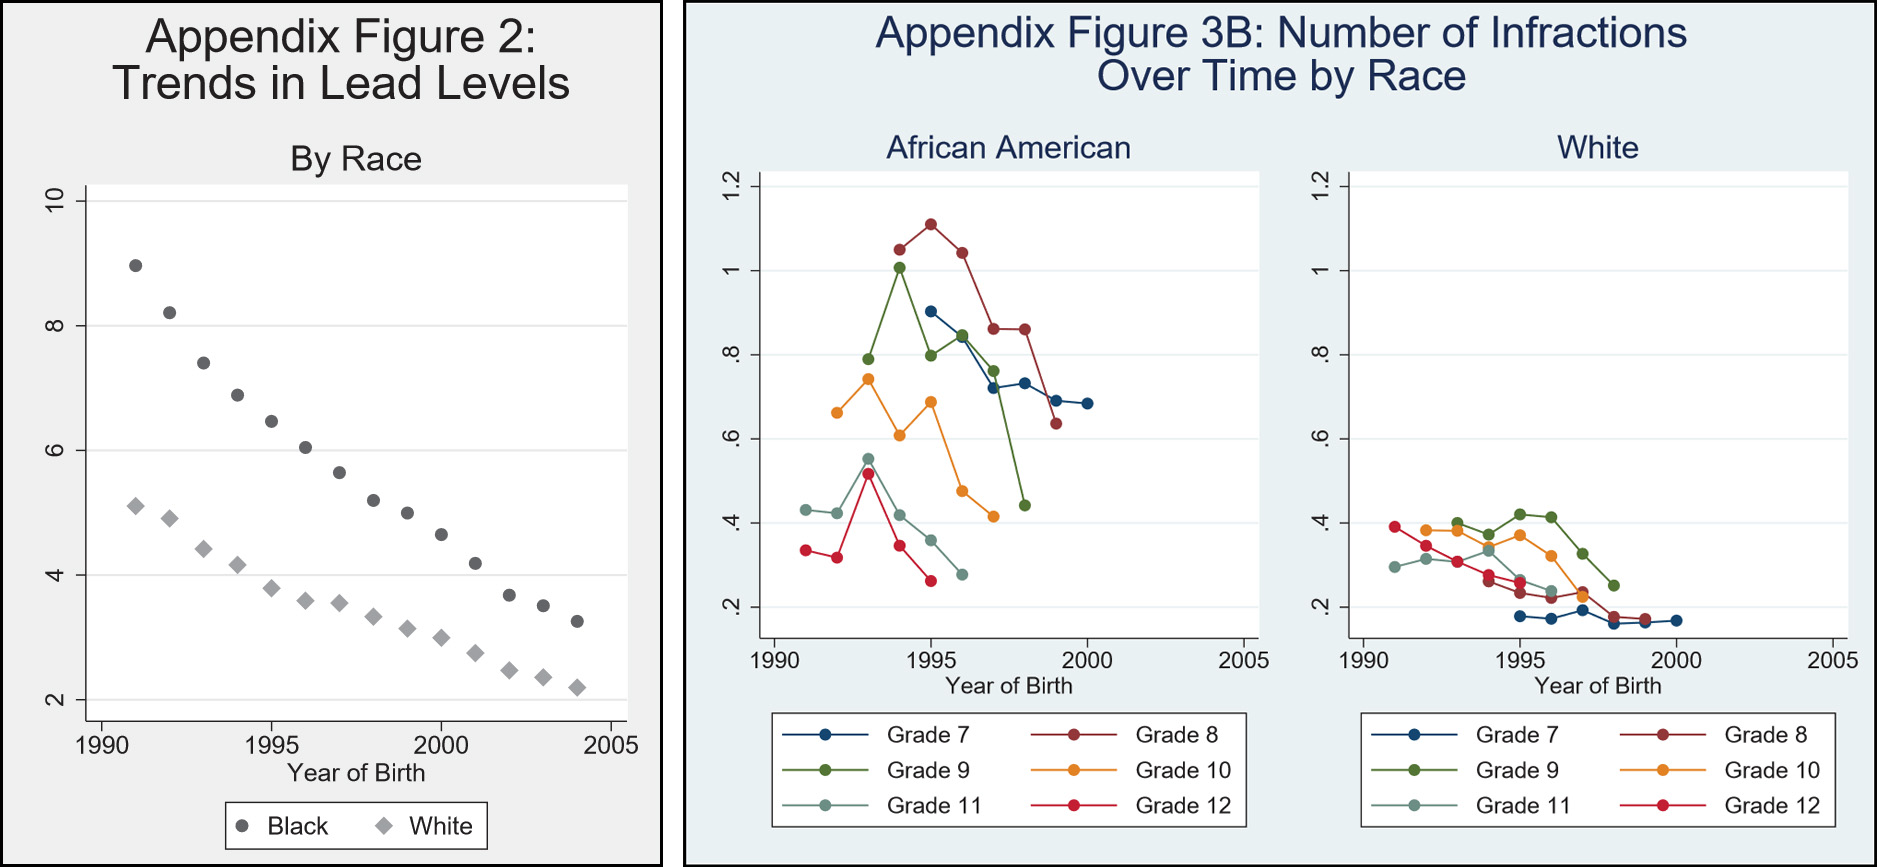
Black juveniles. Since 1991, violent crime rates have declined across the board. However, the arrest rate for black juveniles has dropped more sharply than the rate for white juveniles. Why? Because blacks were more affected by lead in the 60s and 70s. Their crime rate went up more than it did for whites, so when lead was removed from gasoline their crime rate went down more than it did for whites. See also here, which looks at incarceration rates for blacks and whites. And also here.
Cop killers. Police killings by young people have dropped staggeringly since 1990. Among the cohort aged 18-24, the rate of police killings has gone down from 33 per year to 4 per year.
Jamaica, man. The country of Jamaica phased out leaded gasoline between 1990 and 2000. Twenty years later, just as you’d expect, the murder rate began a steep decline. (Homicide in Jamaica has stayed generally lower since then, but has spiked up and down in recent years. That’s because although lead is associated with crime, there are lots of other reasons for crime to go up and down too.)
Lead and terrorism. Based on when they banned leaded gasoline, I predict that Middle East terrorism will begin a long decline starting around 2020 or so.
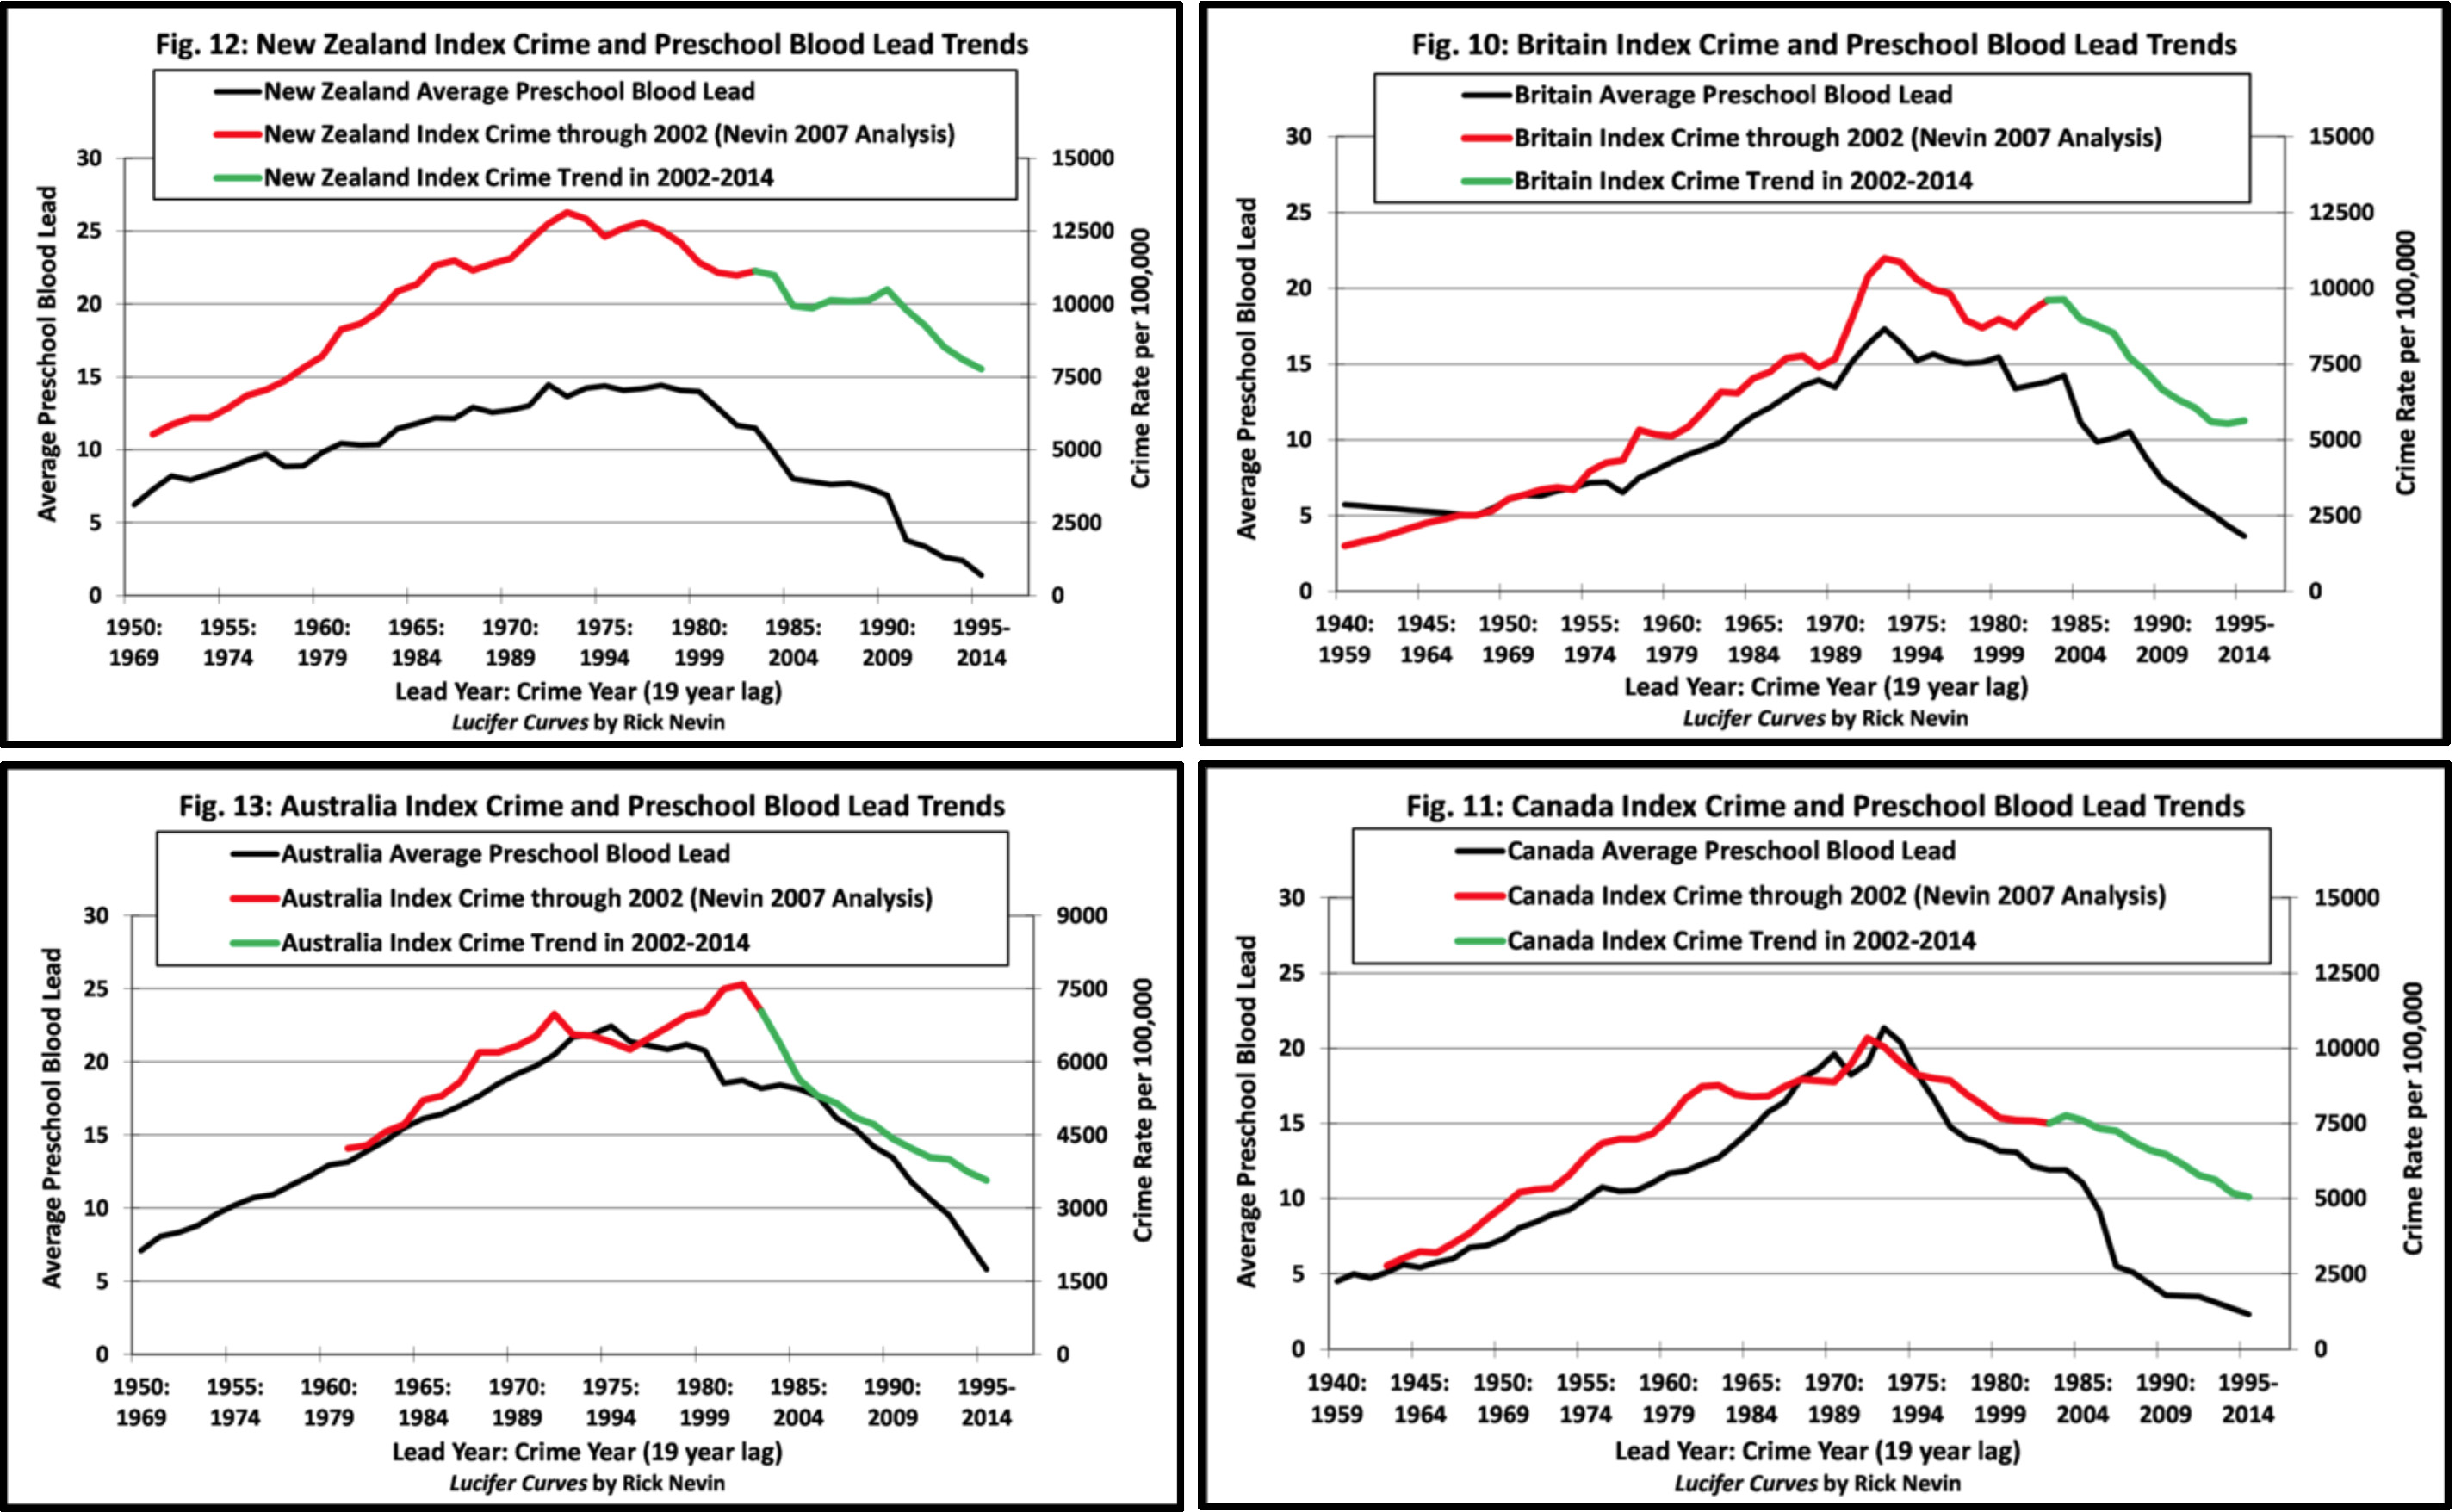
International crime trends. Violent crime began to drop in the United States in the early 90s, about 20 years after we began reducing the lead content of gasoline. But how about other countries? Where can we expect to see crime drops in the future?
George Monbiot and Scott Firestone. Monbiot endorses the lead-crime theory and Firestone criticizes it. I respond, along with a brief summary of the multiple threads of research that support the lead-crime hypothesis. Followup here.
Baselines vs. crime waves. Lots of things contribute to baseline levels of crime. But lead is uniquely able to explain why there was such a huge rise of crime above the baseline during the 60s, 70s, and 80s, followed by an equally huge reduction back to the baseline in the 90s and aughts.
Crime in Japan. Leaded gasoline in Japan was banned completely in 1980. By 2000 the country had an entire cohort of teenagers who had grown up lead free. The lead exposure of Japanese children is now among the lowest in the world, and as a result the Economist reports that crime is so low that police officers are getting bored.
Big cities vs. small cities. Surprisingly, it turns out that once you reduce exposure to gasoline lead, big cities aren’t really all that much more dangerous than small ones after all.
A response to Jim Manzi. This is a wonky post responding to Manzi’s generic critique of econometric analysis of complex social issues.
High school fights. If high lead levels dispose some people to lives of violent crime later in life, it should dispose even more people to lives of moderately higher violent behavior. We don’t have data for schoolyard fights in the 60s and 70s, but we do have data since 1992, and they’ve been declining the whole time, just as the lead-crime hypothesis predicts.
Crime and race. In the postwar era, black children were exposed to much more lead than white children. This explains some of the racial differences in both crime rates and incarceration rates.
Red Barns and Rural Crime. In the 19th century, most American farmers painted their barns red. However, around 1880 better quality white lead paint became cheaply available thanks to railroad expansion and ready-mixed paint available from Sears Roebuck and others. About 20 years later, rural homicides increased dramatically, nearly catching up to murder rates in cities—which, of course, had been using lead paint for decades.
Bill de Blasio. In 2013, I predicted that crime in New York would continue to stay low no matter what Bill de Blasio did as mayor. Why? Because crime declined due to reductions in lead, not because of CompStat or stop-and-frisk or anything that Rudy Giuliani or Mike Bloomberg did. It’s now 2018. I was right.
Cohorts and crime. The arrest rate of young people is down substantially since 1991. This is because young people today grew up with far less lead poisoning than young people a couple of decades ago. But what about older folks? They grew up with a bit more lead poisoning than people who were middle-aged in 1991. And guess what? Their arrest rate is a little higher than the same age cohort in 1991.
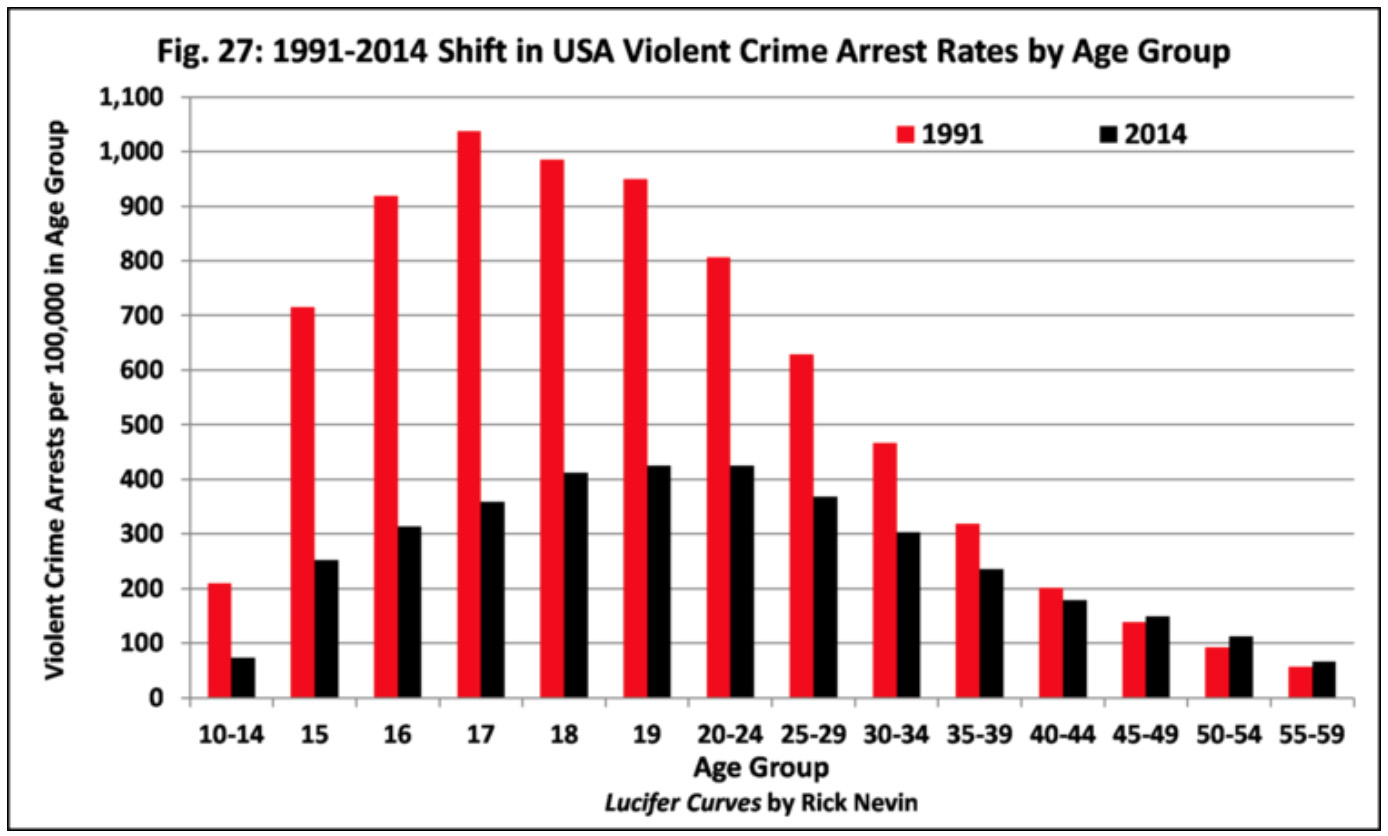
More cohorts. Mike Males looks at incarceration rates by age and finds a perfect correlation. Incarceration is down substantially for the youngest cohorts; about the same for middle cohorts; and up for older cohorts. Incarceration rates are down a stunning 60 percent among 18-19 year olds, which is consistent with the lead-crime hypothesis. Young cohorts these days are pretty lead free and far less violent than in the past. Older cohorts, by contrast, are still part of Generation Lead, and they’re committing more crimes compared to older cohorts from the 1990s, who mostly grew up before the lead era. See also here. And here.
Ethanol and São Paulo. In 1975, after the first Arab oil embargo, Brazil started a campaign to replace gasoline with ethanol. Most of the ethanol went to São Paulo, and by the mid-80s half the cars in the province had stopped using gasoline. Sure enough, 18 years later the murder rate started dropping dramatically. Today it’s at one-third the level of 2002, when the decline began.
Violent crime in Britain. The violent crime rate in Britain peaked in 2007 and then dropped sharply. This is consistent with Britain’s experience: They banned leaded gasoline in 1988, and then made the switch to unleaded very quickly.
Criminologists and lead. A criminologist provides a pitch perfect dismissal of the lead-crime hypothesis because, by God, crime is a sociological problem and that’s that.
The politics of lead. Everyone has their own pet theory of why crime rose in the 60s and 70s: guns, poverty, drugs, the counterculture, the breakdown of the family, black “pathologies,” racism, moral decay, the decline of religion, and so forth. This is why so many people dislike the lead-crime hypothesis. If it’s true, it means your pet theory probably isn’t. And nobody wants to give up their pet theories.
3. Studies of Lead and Crime Since 2012
2014, Reyes: A second study from Jessica Wolpaw Reyes, this time using data from the National Longitudinal Study of Youth. She finds that early childhood lead exposure leads to “an unfolding series of adverse behavioral outcomes: behavior problems as a child, pregnancy and aggression as a teen, and criminal behavior as a young adult.”
2013, Aharoni et al.: Brain scans show that prisoners with lower activity in the anterior cingular cortex (ACC) are twice as likely to return to crime after they’re released. This is consistent with the lead-crime hypothesis: the effect of childhood lead poisoning is permanent loss of tissue in the ACC, which controls emotional regulation, impulse control, attention, verbal reasoning, and mental flexibility.
2017, Aizer and Currie: The authors take advantage of an extremely detailed dataset of children in Rhode Island that allows them to track the effect of lead on individuals, rather than just averages on an entire population. For each child, they measure school suspensions and juvenile detentions along with two measures of lead poisoning: (a) childhood blood lead levels and (b) distance from major roadways, which are associated with a large concentration of lead fumes. In both cases, they find a substantial association of lead poisoning with future juvenile delinquency.
2014, Liu at al.: A prospective study of childhood lead-poisoning in the Jiangsu province of China. The study so far has followed the children only up to age six, but it has already found “significant associations between blood lead concentrations and increased scores for teacher-reported behavioral problems.”
2017, Billings and Schnepel: A very powerful study of two groups of North Carolina two-year-olds born in the 1990s. Both groups tested high for lead poisoning, but one was slightly above 10 μg/dl and one was slightly below. The high group received an intervention that substantially lowered their lead exposure. Later in life, the intervention group had far lower arrest rates for violent crimes.
2017, Grönqvist et al.: A study of lead in Sweden concludes that “early lead exposure may have deleterious effects on the academic performance among children with blood lead at least at levels from 3 μg/dL and above, and criminal behavior from 5 μg/dL.” The researchers also found the lead had strong negative effects on social maturity, emotional stability, and the ability to make and carry out plans. All of these are things related to violent crime.
2016, Feigenbaum and Muller: An entirely different approach to lead and crime. The authors compared cities in the early 20th century that installed lead water pipes vs. iron water pipes. This was a fairly random choice, usually based on whether a lead pipe factory was nearby and could offer a better price than iron pipes. Two decades later, the lead pipe cities had murder rates 14-36 percent higher than the iron pipe cities.
2014, Wolf: An article in Chemical and Engineering News that focuses on recent neuroscience studies showing what lead does to the brain and how this is associated with violent crime.
2016, Boutwell et al.: A team of researchers studied crime at the census tract level in St. Louis. They found “a relatively strong effect of lead on behavior, especially violent behavior.” Statistician Andrew Gelman confirmed that the analysis in the paper was all kosher.
2016, Lauritsen et al.: The authors compare lead poisoning to crime rates, but instead of using the FBI’s numbers for crime (reported by police departments), they used the NCVS survey of crime (as reported by interviews with families). They conclude that if you used the NCVS data the correlation between lead and crime is zero. However, there are some pretty strong reasons to suspect that something is wrong with this study.
2016, Taylor et al.: An Australian team used records of atmospheric lead to compare neighborhoods and states. Lead was a strong predictor of assault rates 21 years later. An increase in atmospheric lead of 1 microgram per cubic meter led to an increase in assault rates of 163 per 100,000 population.
2017, Beckley et al.: A prospective study of children in Dunedin, New Zealand, provides support for the lead-crime hypothesis, but only modestly. This is unsurprising since New Zealand generally had fairly low levels of lead poisoning to begin with.


