The last time I checked on the 2017 NAEP tests, their website said results had been delayed and would be released…eventually. So I missed it last week when they finally came out. As Bob Somerby says, this isn’t too surprising since barely anyone in the media bothered reporting on it.
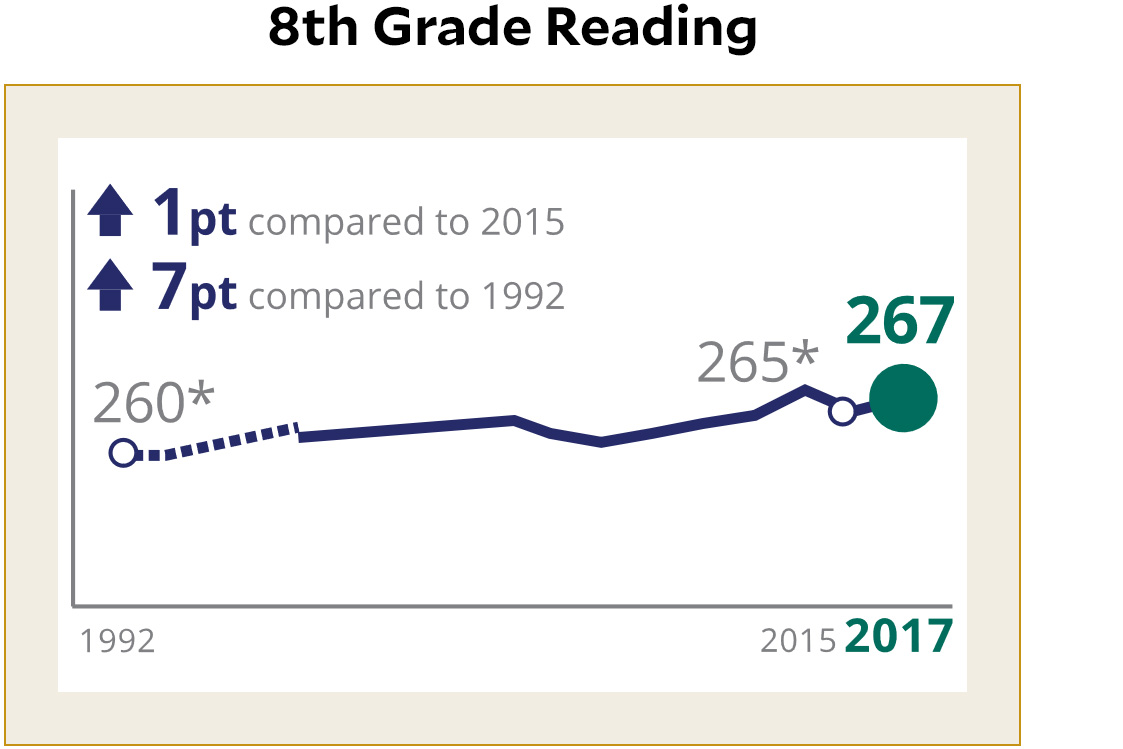
Why didn’t the new scores get any attention? Too much Trump babble, perhaps. Or it might have been that the overall results were kind of mediocre, but not horrible or anything. So that leaves reporters with no easy narratives to attach to this year’s results. That said, if you look closely you’ll see some troubling news. First off, the people who make charts for the NAEP have difficulty counting to two:

This would have been more perfect if it had been the result for 8th grade math, but you go to war with the embarrassing errors you have, not the embarrassing errors you wish you had. NOTE: See update here.
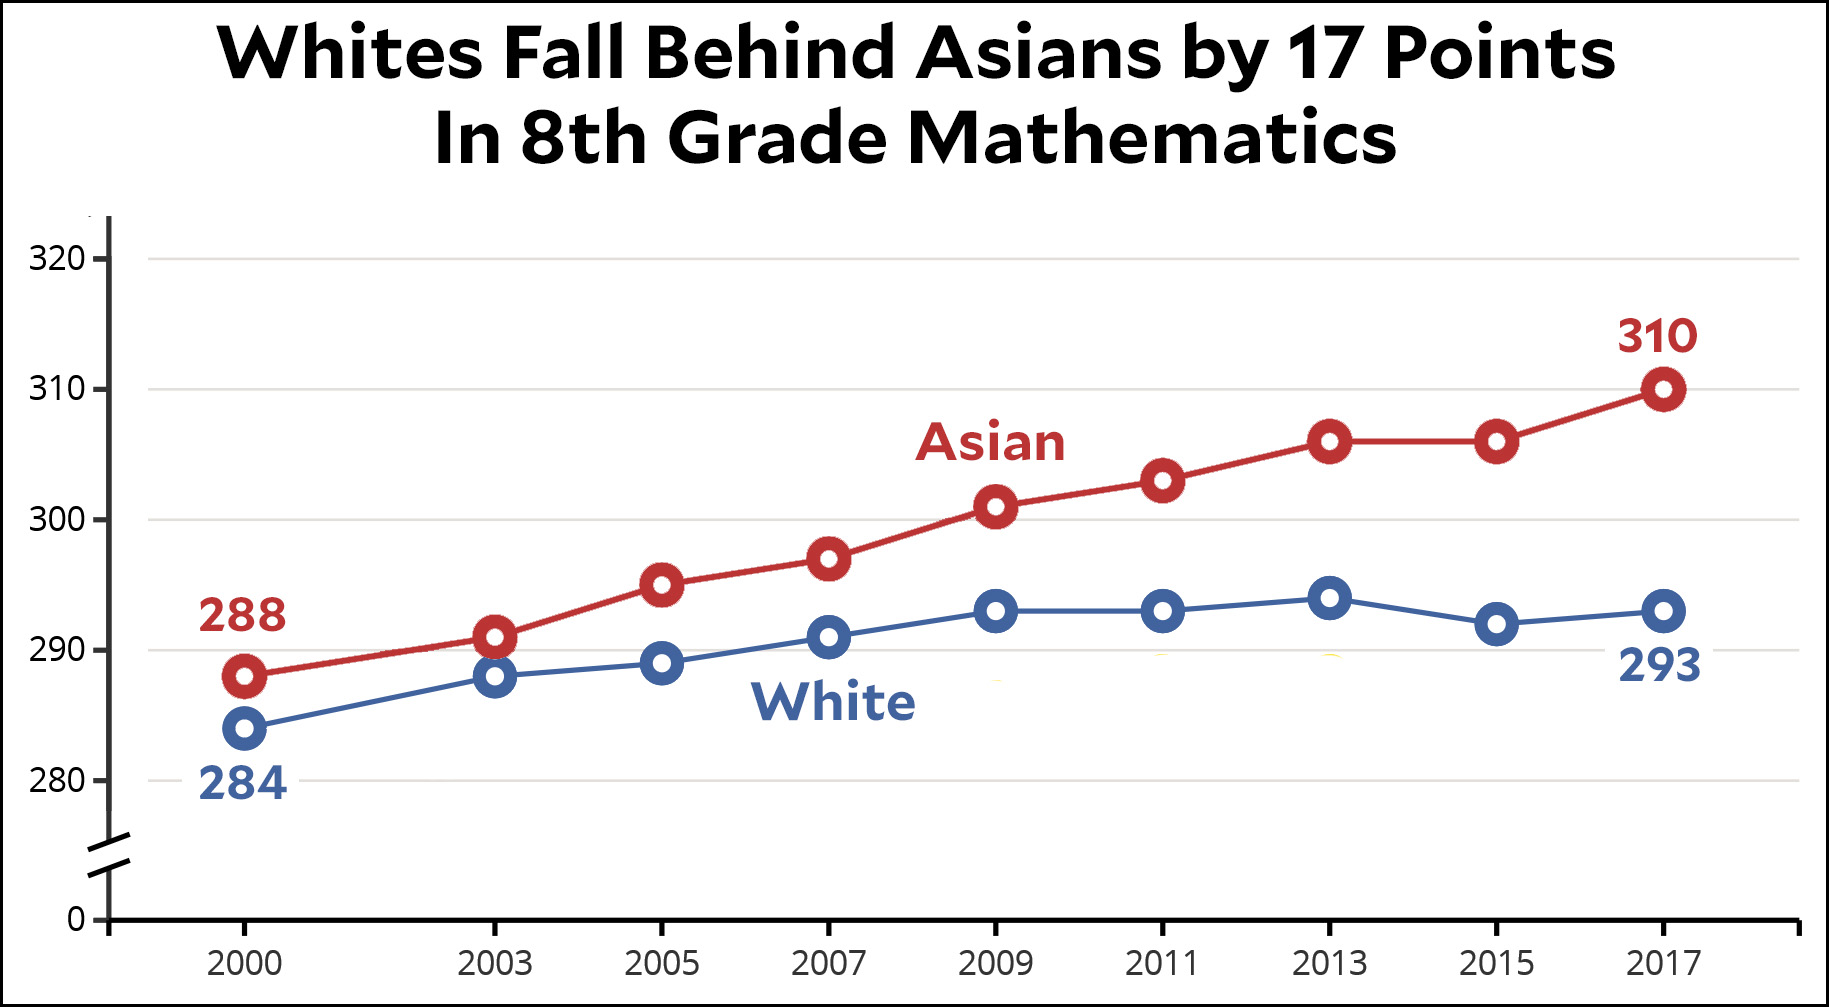
Second, our white children are continuing to fall behind in math:

These results obviously demonstrate that there’s something wrong with white culture, even though politically correct liberals try to tap dance around it. Is it because white families don’t value education? Or because white kids are ostracized if they “act Asian”? Or is it something innate in white brains? More op-eds on this, please.
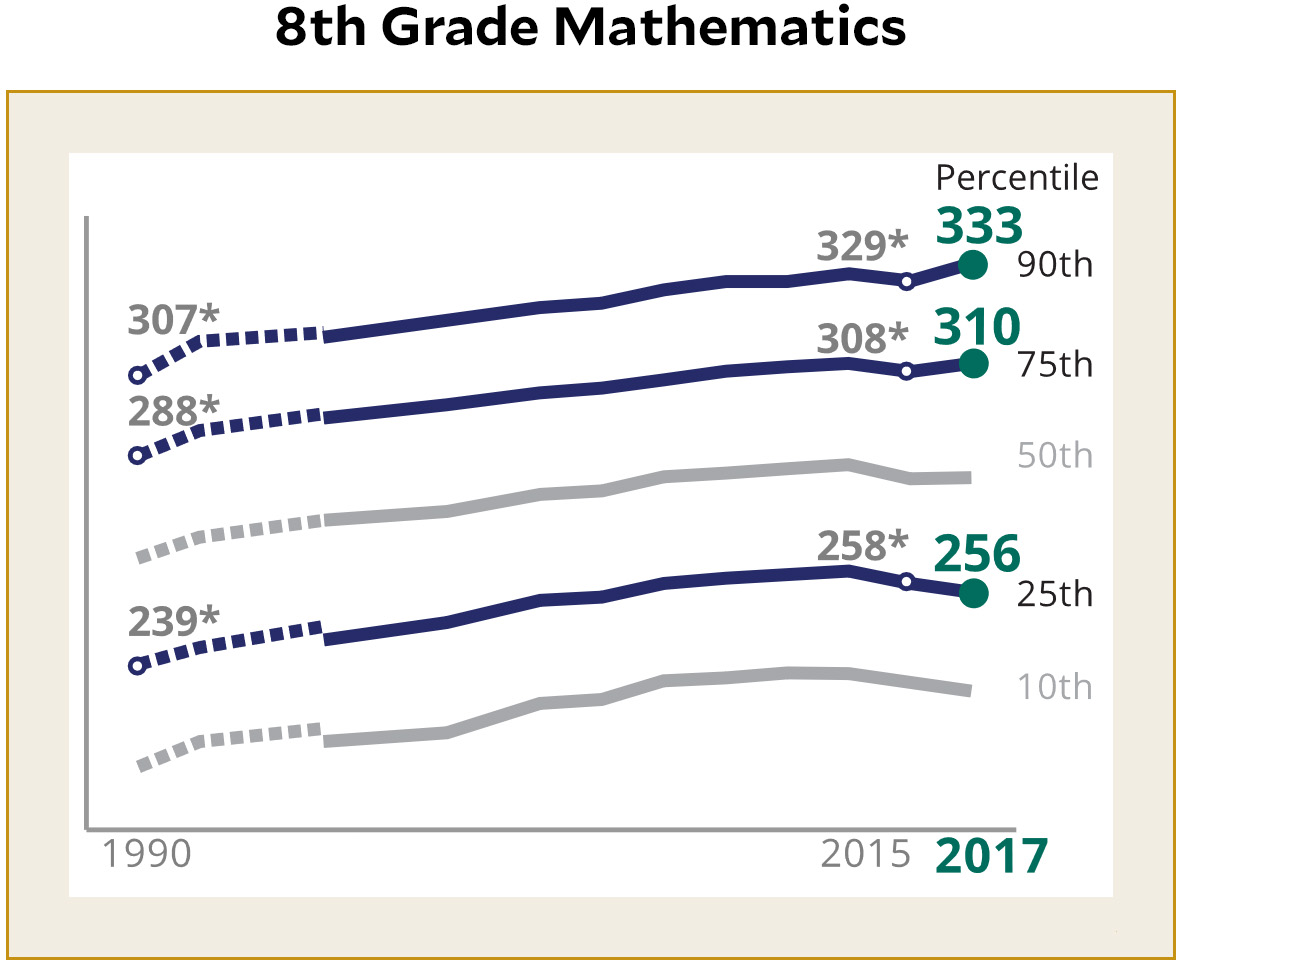
Finally, the rich are getting richer and the poor are getting poorer. Among the smartest kids, math scores are going up. Among the dullest, scores are going down. In 1990, the slow kids were 68 points behind the smart kids. Today they’re 77 points behind.

If you sense that I’m not taking this as seriously as I should, I plead guilty. But apparently no one else cares much, so why not just have a laugh instead? Except for that final chart about the growing smart-slow gap. That really is kind of disturbing. The full results are here.


