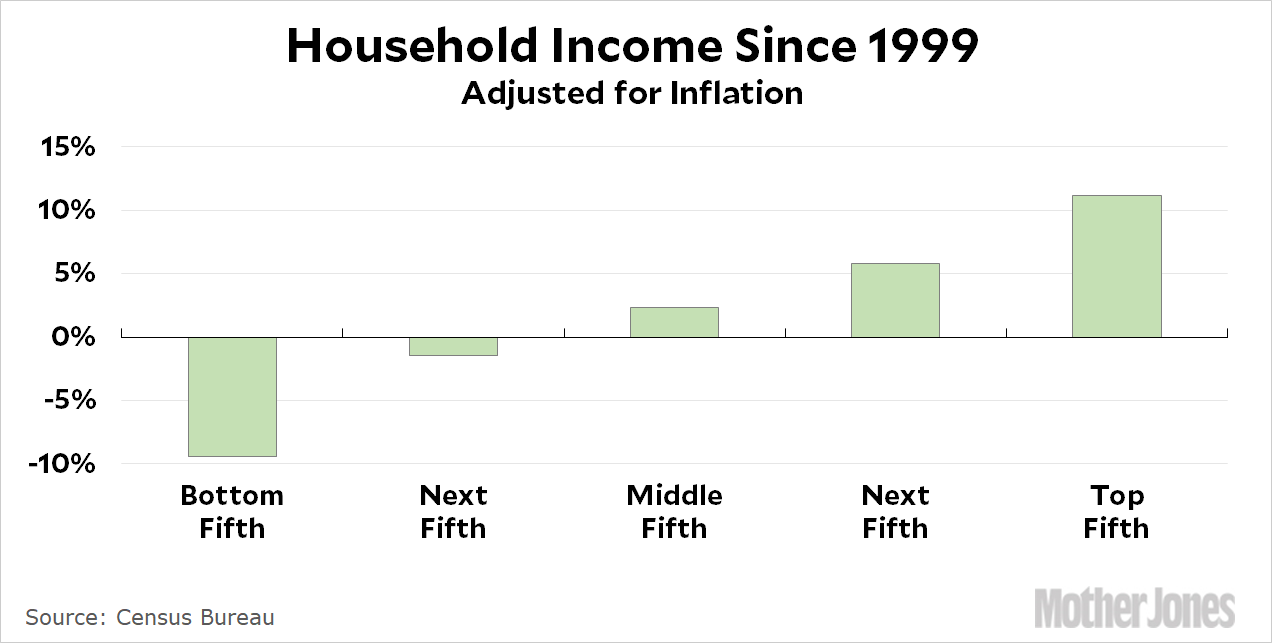
Here’s another chart for you if you want a better sense of just how well the economy has been working for everyone over the past couple of decades:

Generally speaking, household income peaked in 1999 and has gone up and down since then. But for some, it’s been more down than up. Even after 110 months of expansion, the lowest earners make nearly 10 percent less than they did during the last economic peak. The top fifth, by contrast, earns 11 percent more than they did during the dotcom peak.
It’s been a tough 20 years. The poor have done abysmally; the middle class has stagnated; and even the affluent have only improved their earnings moderately. Meanwhile, real GDP per capita has increased a very nice 23 percent since 1999. So if GDP is up 23 percent, but even the affluent are up only 11 percent, where has all the money gone? The Census Bureau doesn’t tell us, but I’m sure you’ve already guessed: to the really, really rich. It’s a good time in America to be part of the top 1 percent.


