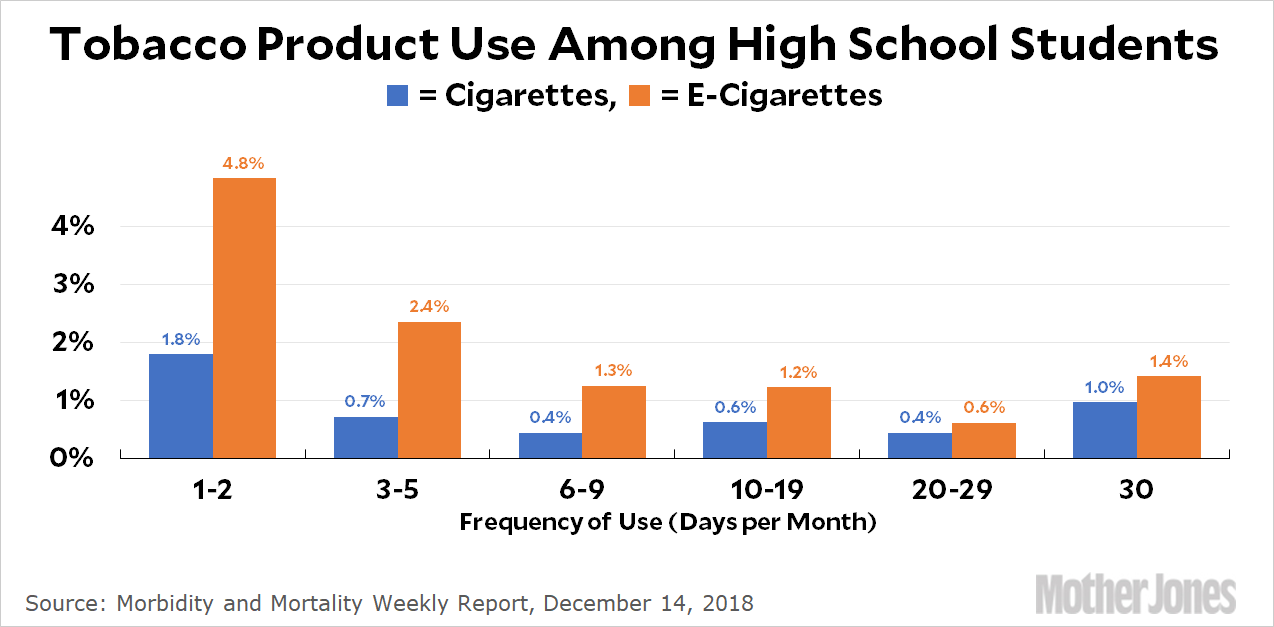
I’ve been browsing recent issues of the CDC’s Morbidity and Mortality Weekly Report, as one does on a lazy Saturday morning, and a recent issue provided a bit more information about the popularity of vaping. It’s not the precise data I’d like, but it’s a little more than I had the last time I wrote about it. This chart shows not just whether high-school students vaped during the past 30 days, but how often they vaped compared to cigarette users:

There are two things missing from this. First, it’s an average of 2015-2017. We know that vaping has been on the rise, so this probably underestimates e-cigarette use somewhat. Second, it doesn’t distinguish between nicotine and non-nicotine vaping. At a guess, non-nicotine vaping dominates the 1-10 day categories, but nicotine vaping dominates the 10-30 day categories. Also note that the raw data used in this report shows these categories as a percent of people who use the products. I converted this into total use assuming that 5 percent of high school students use cigarettes (cited here) and 11.7 percent use e-cigarettes (cited in the first paragraph of the MMWR report).
What this all means is that you shouldn’t take these numbers to the bank. They’re useful, but not guaranteed to be super-accurate.
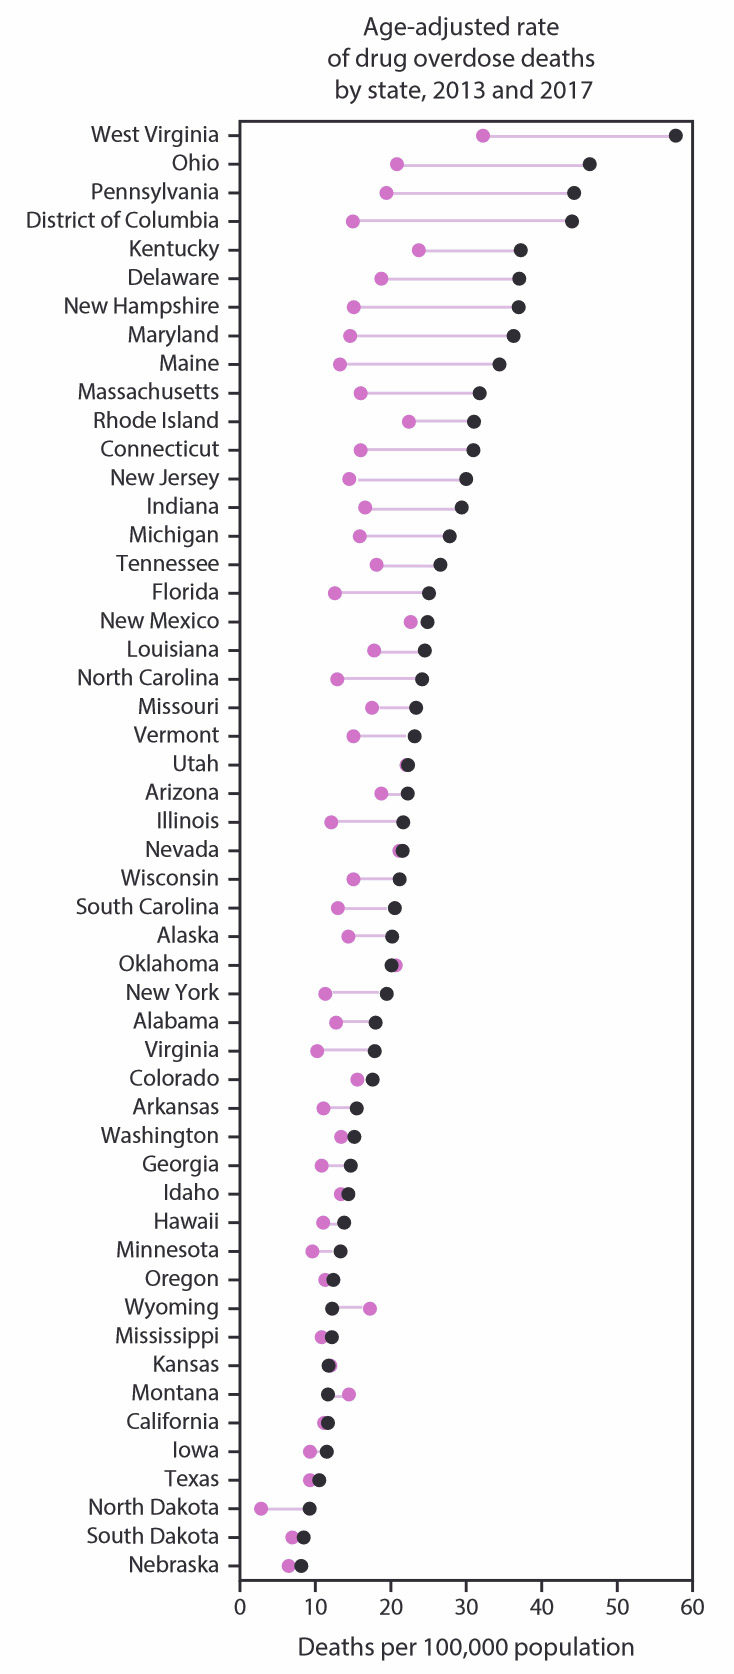
And now for something completely different: are you curious about how your state is doing in the opioid crisis? The chart below shows the change in death rate from all drug overdoses between 2013 and 2017. In some states, like West Virginia, Ohio, and DC, the death rate doubled or more. In others, like California and Kansas, it was low and didn’t change at all. And finally, there were even two states, Wyoming and Montana, that showed a decrease.


