If you want to know what things are like on our southern border, one way to find out is to go down there and talk with the people who live there. Learn about their lives, and the lives of folks on the other side who want to get in. Put a human face on the whole thing.
But that’s not my style. When I want to know what’s happening, I look at the numbers. So here you go: five pairs of charts that tell the real story of the so-called crisis on our southern border.
1. The Basic Numbers
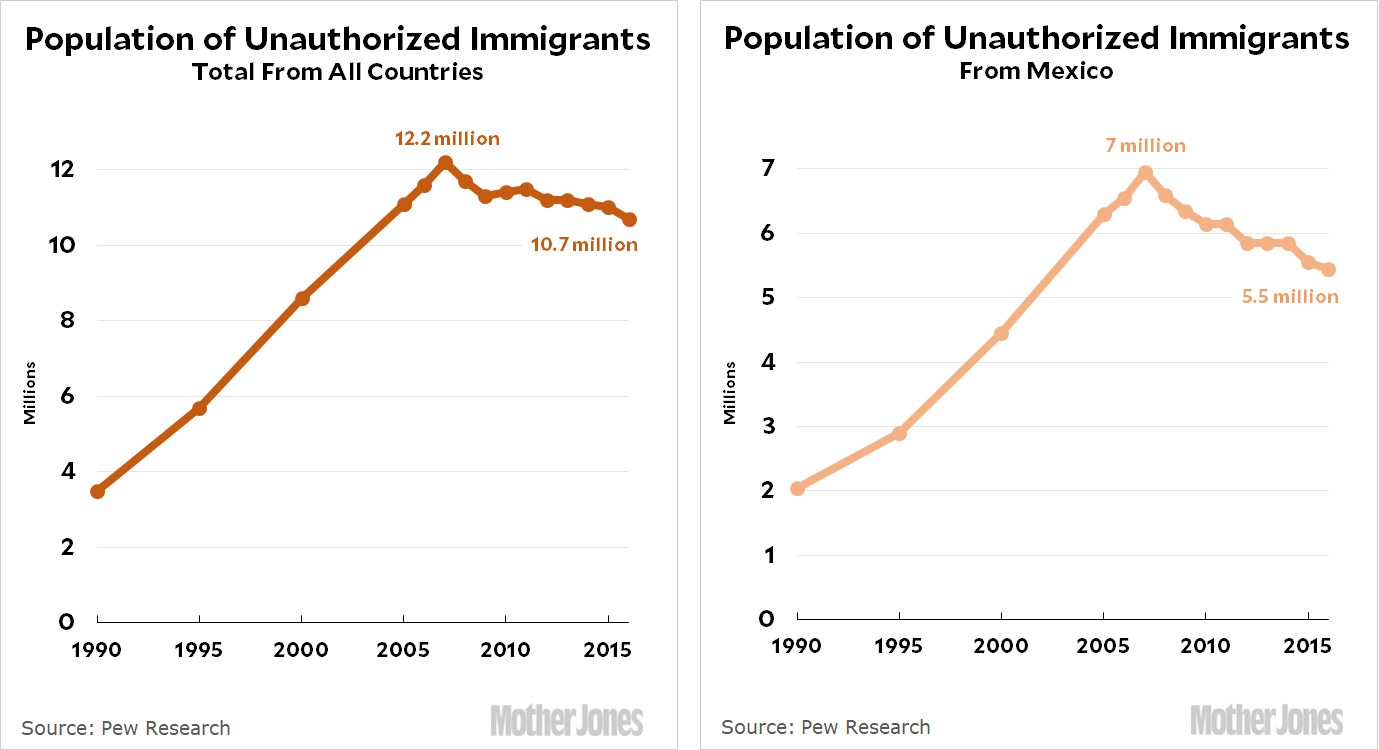
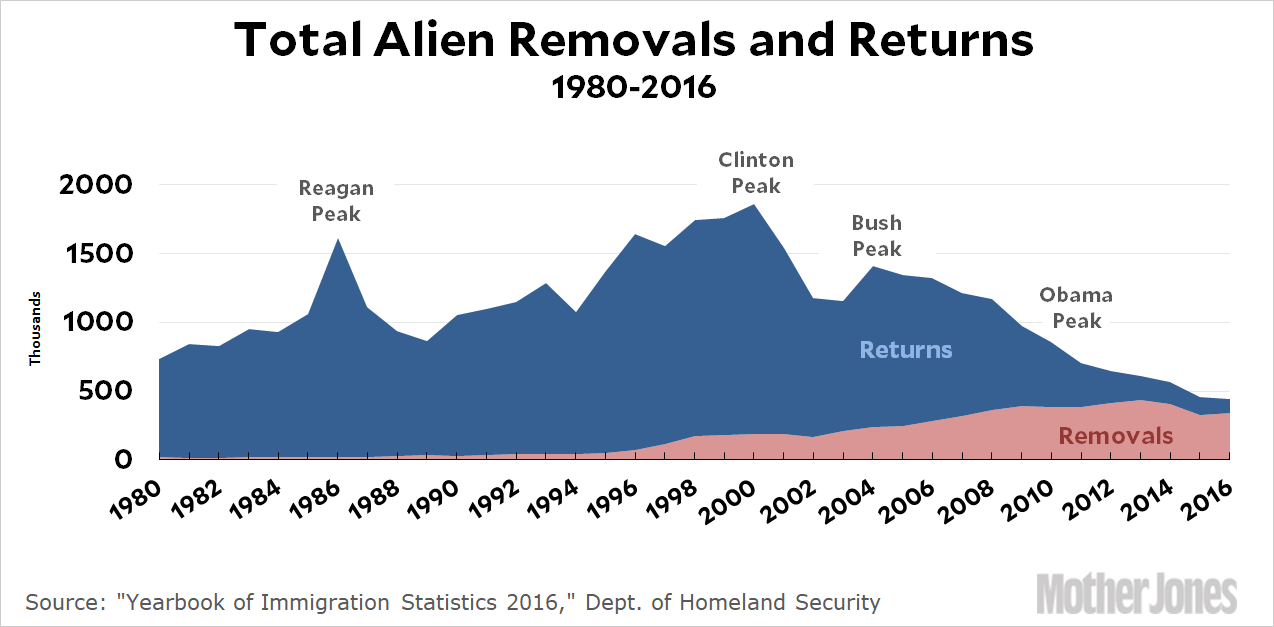
Since its peak in 2007, the population of unauthorized immigrants has been steadily dropping. And the number of deportations and other removals has been dropping every year since 2004.
2. Apprehensions
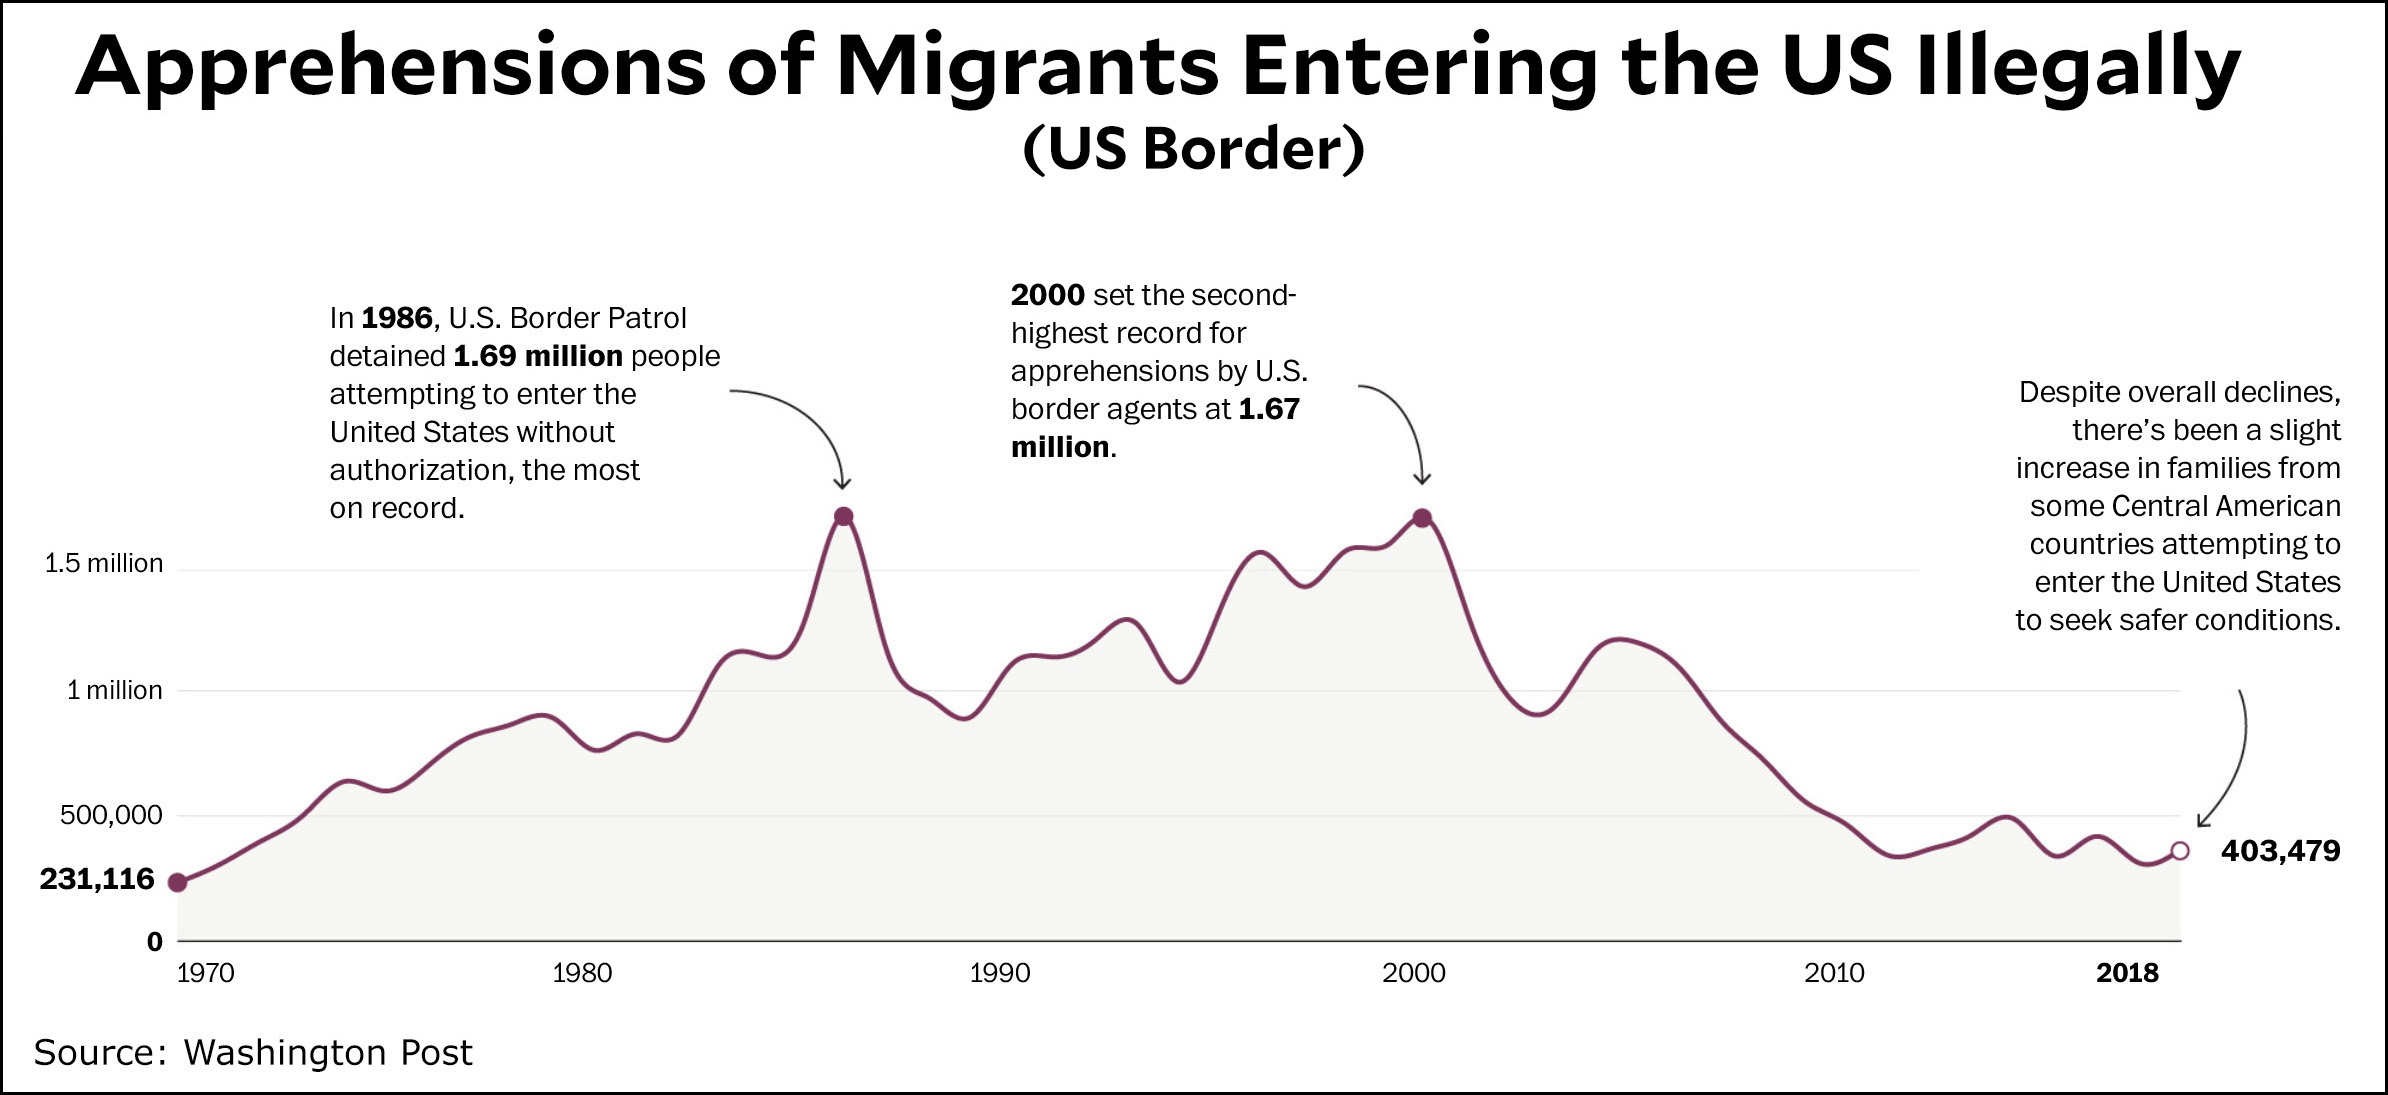
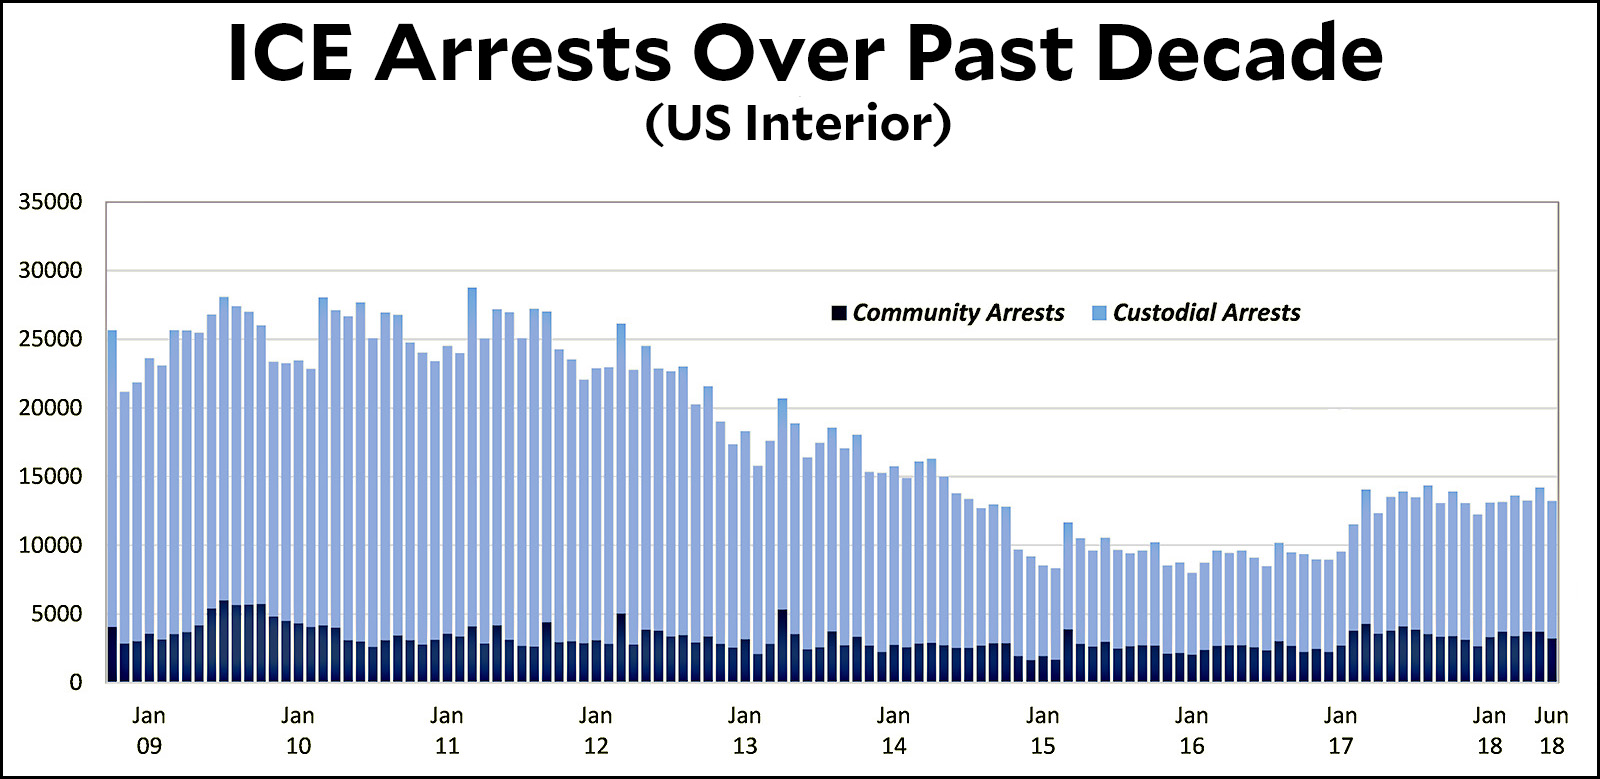
The number of unauthorized immigrants apprehended at the border has been dropping ever since 2000. Border Patrol agents apprehend about 400,000 migrants per year, one quarter the number of two decades ago. In the interior of the country, ICE agents arrest about 13,000 people per month, half the level of only six years ago.
3. Crime
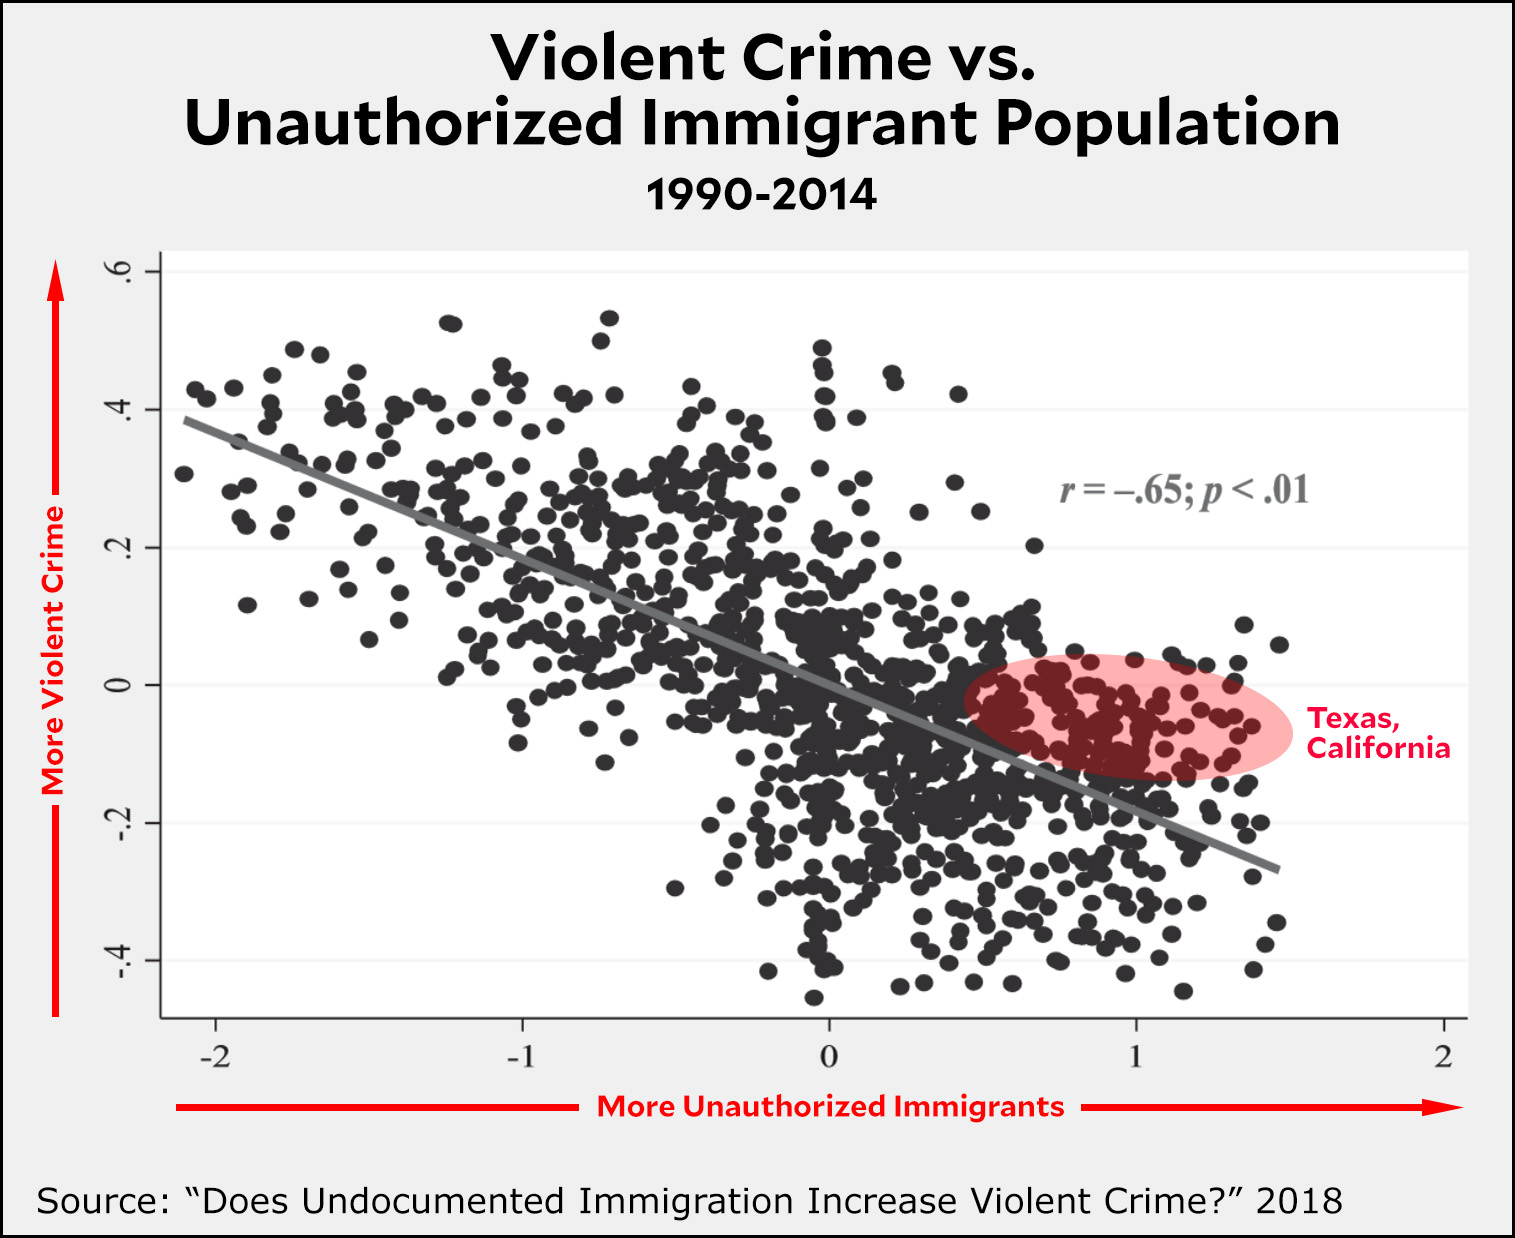
Most of the evidence suggests that unauthorized immigrants commit less violent crime than US natives. As you can see, the top chart shows that states with higher levels of unauthorized immigrants also tend to have lower crime rates. (Note: If this seems unlikely to you, it’s probably because you think of places like Texas and California as high-crime states. They aren’t. California has always been below the national average, and Texas has been below it for all but a few years since 1990.)
Don’t take this chart to mean more than it does. Despite the careful work of the authors, I don’t think it proves that unauthorized immigrants commit substantially fewer crimes than natives. There’s just too much going on to say that with confidence, and anyway, the size of the immigrant population is too small to drive large differences in crime rates at a state level. However, it does provide pretty strong evidence that unauthorized immigrants don’t commit crimes at higher rates than natives. Most likely, they’re about equally crime prone compared to natives, or perhaps a bit less.
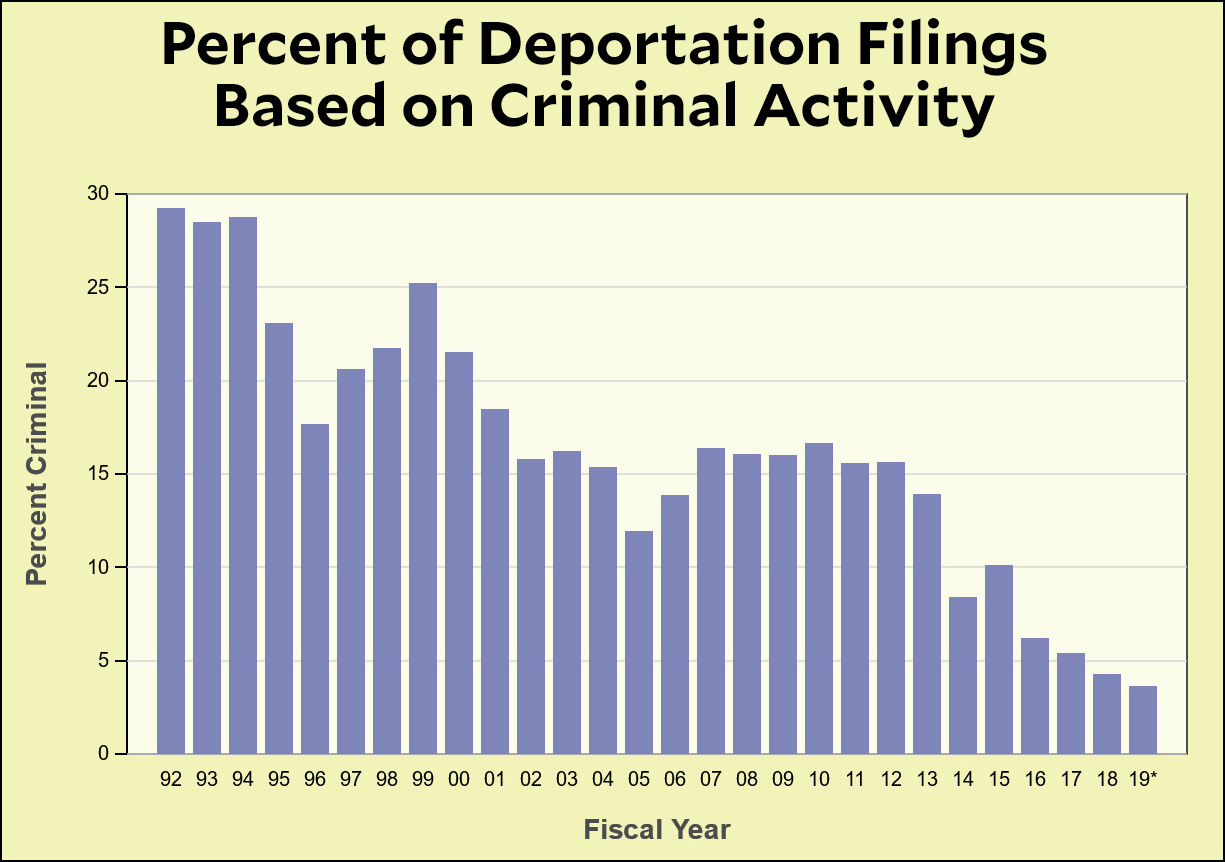
The second chart shows the percentage of deportations that are based on criminal activity. Under four different presidents, it’s been going down steadily. This suggests pretty strongly that there simply aren’t very many criminals to deport these days.
4. Drugs
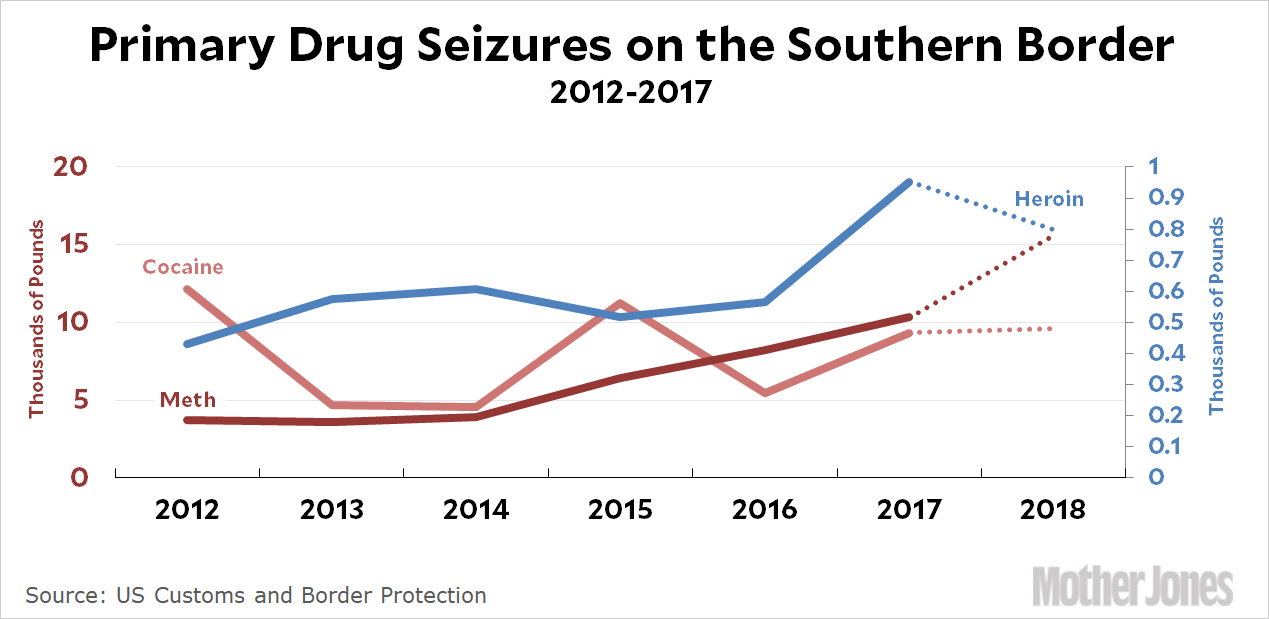
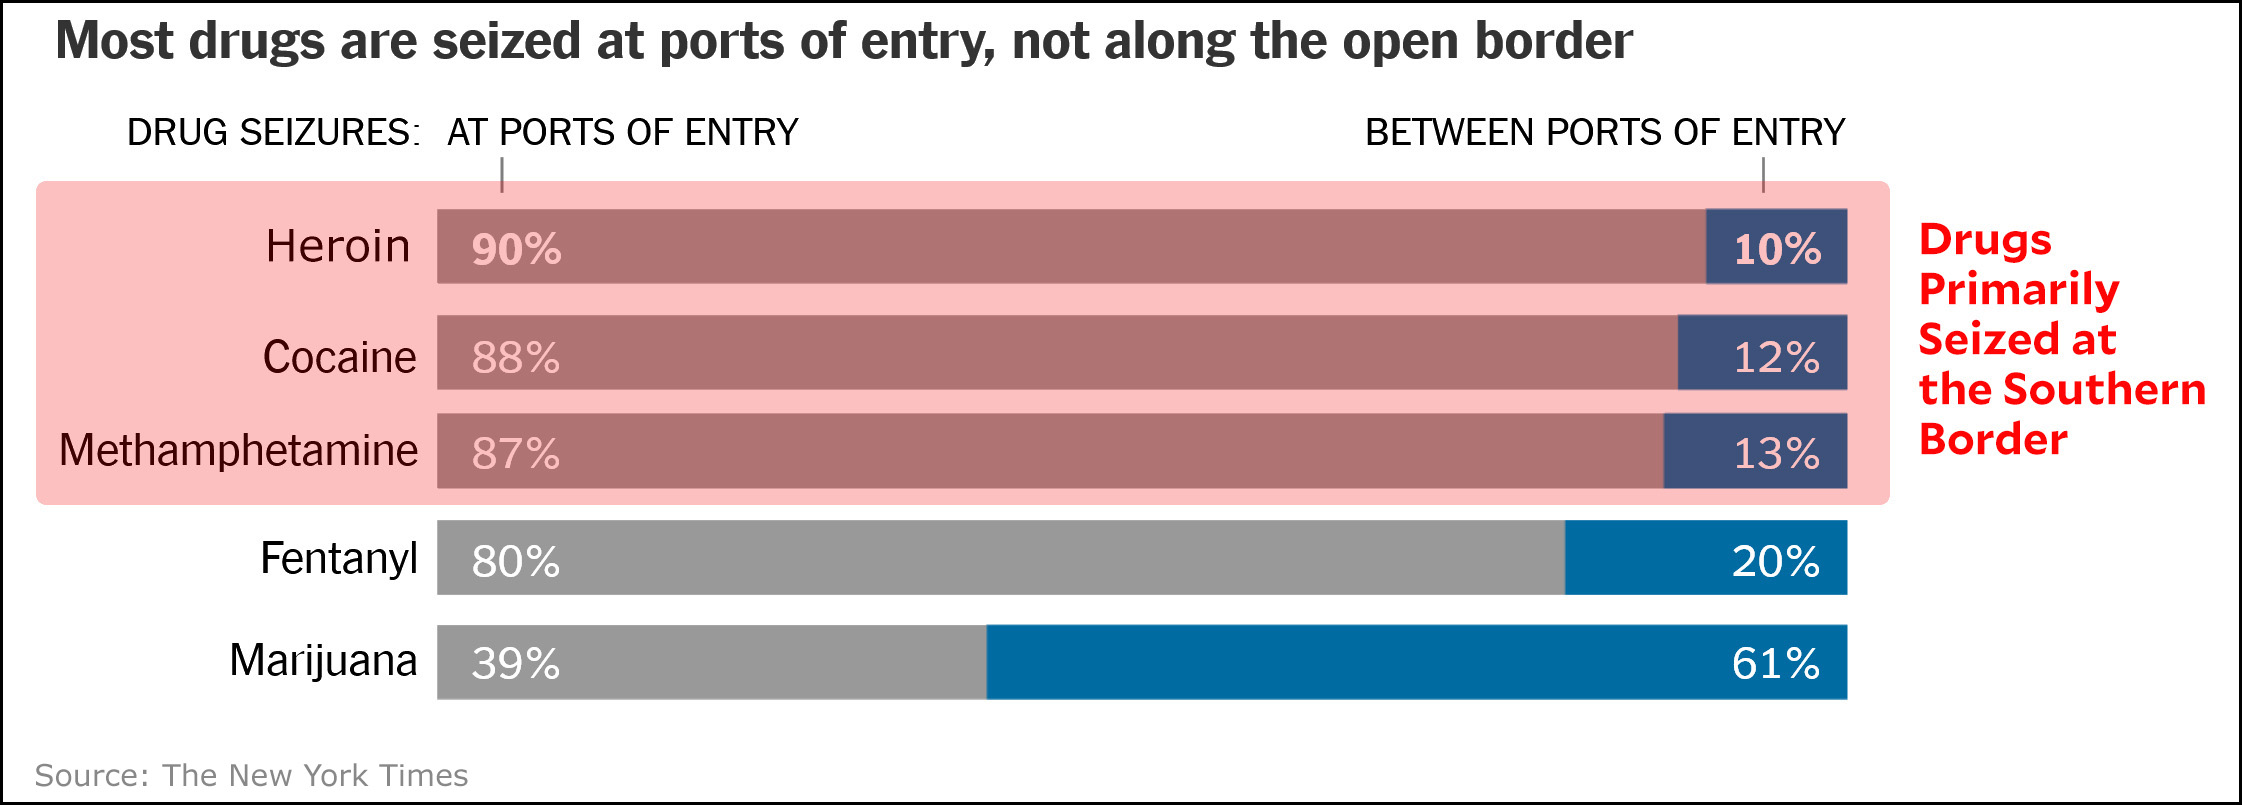
Although the “crisis” language is overblown, traffic across the border in illicit drugs has clearly been rising. However, as the second chart shows, nearly all of this happens at ports of entry, where the drugs are hidden in cars or trucks. Building a wall would have almost no effect on this.
5. Asylum
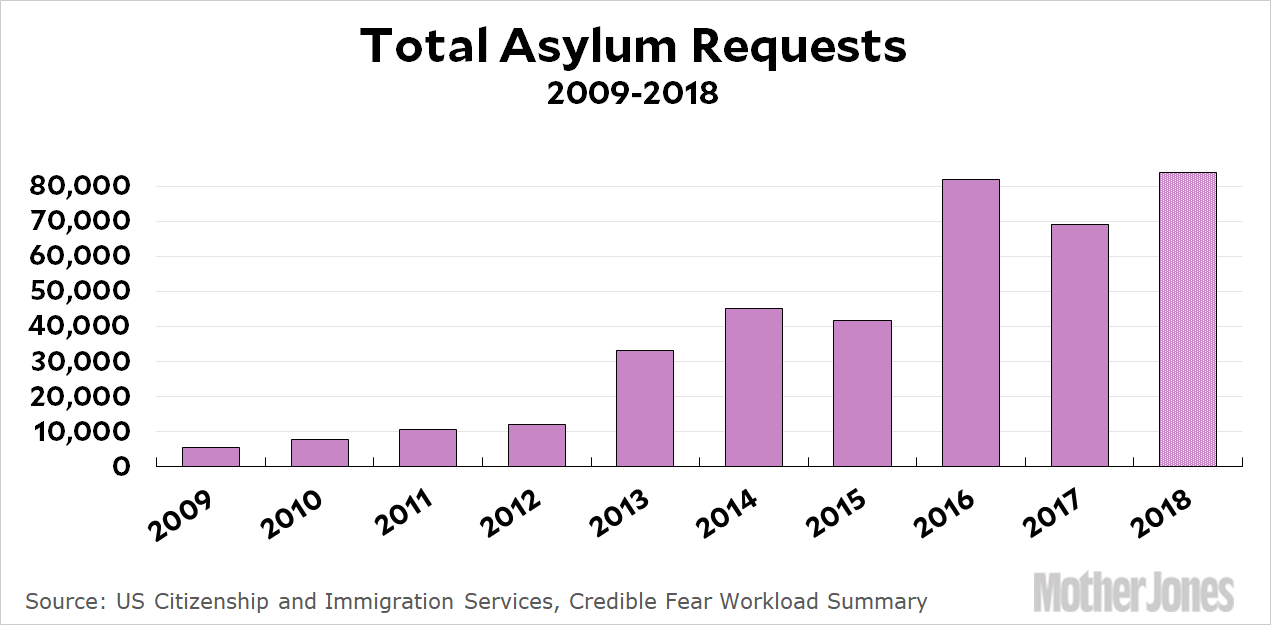
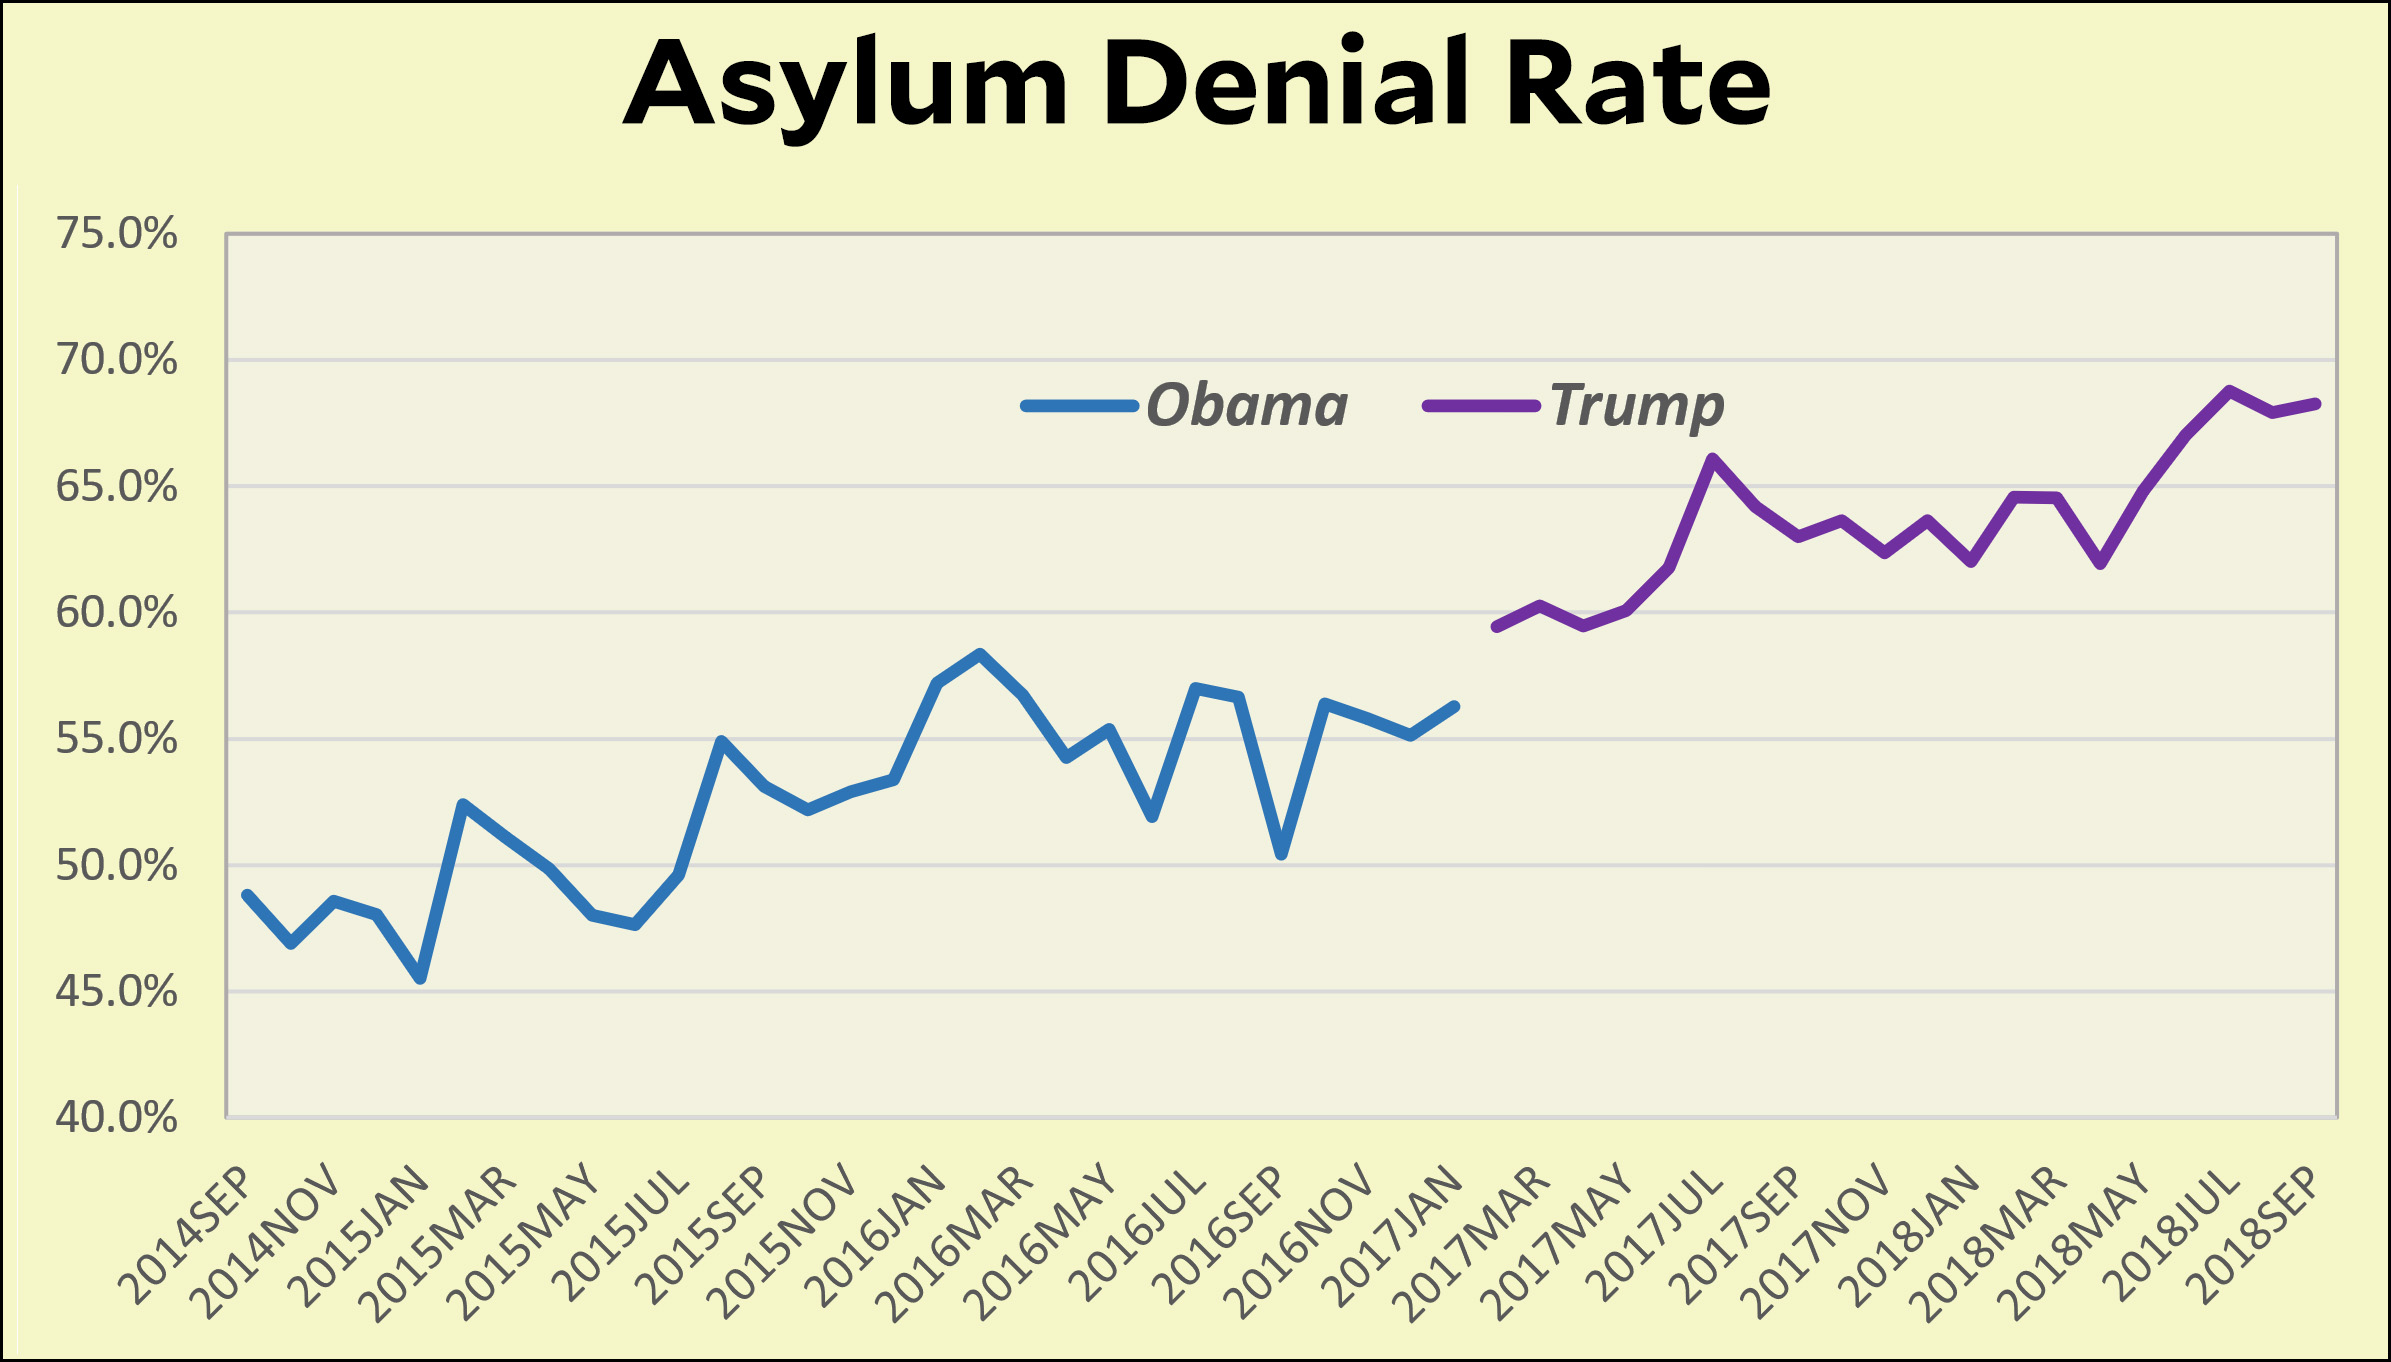
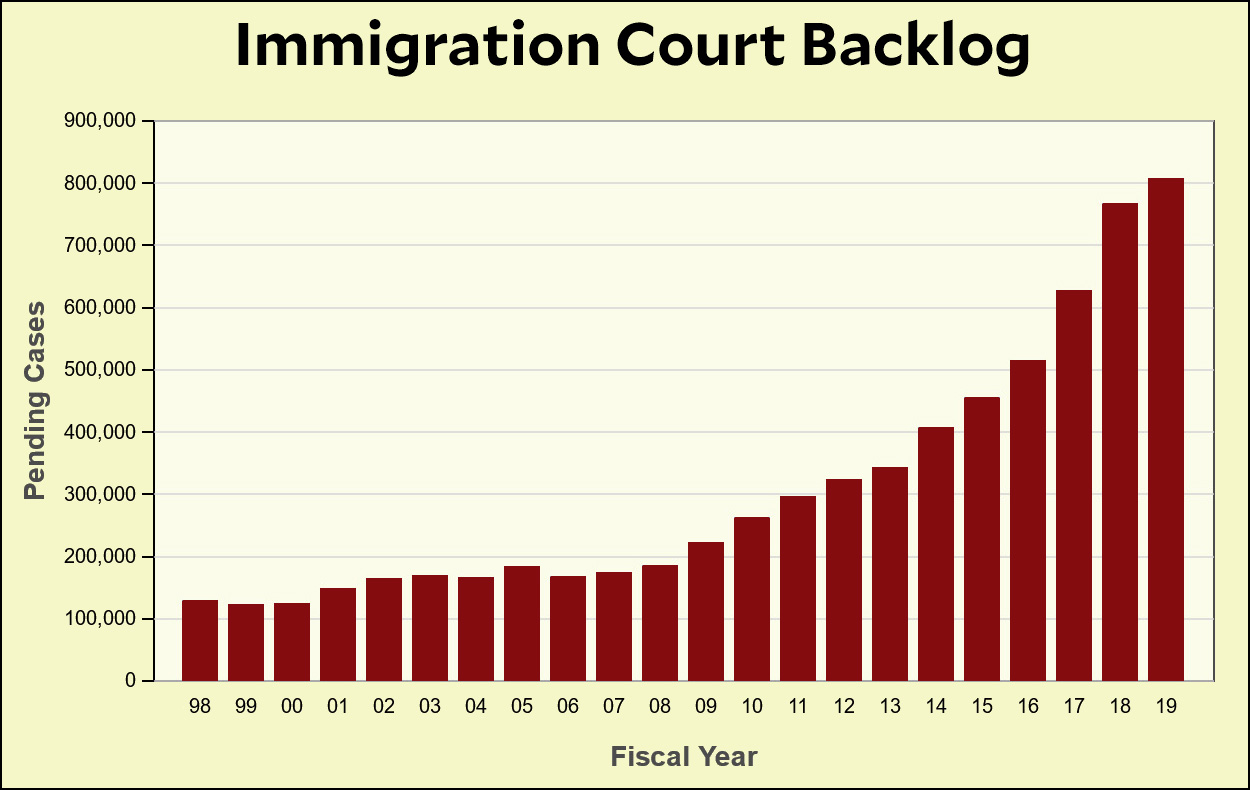
If there’s plainly no crisis in terms of border crossings, apprehensions, crime, or drugs, there is a humanitarian crisis at the border. The number of asylum requests has been rising steadily for the past six years, and the denial rate has risen from 55 percent to 70 percent under President Trump. However, this barely tells a fraction of the story: there are now over 800 thousand pending cases in immigration court, a backlog that will keep growing at an astronomical rate unless we hire more judges—which we need—instead of more border agents.
