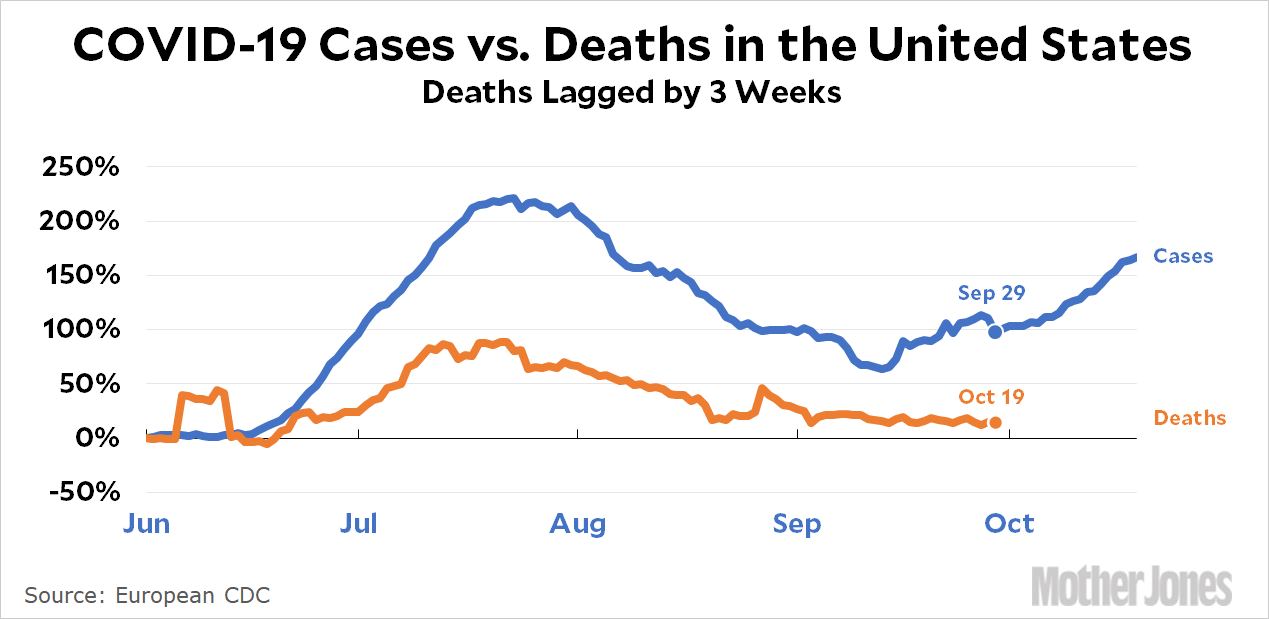
Here’s a chart showing COVID-19 case growth since June 1 along with COVID-19 mortality growth lagged by three weeks:

As you can see, there is still a correlation: when cases rise, deaths rise three weeks later, although by a smaller amount. There was a brief dip in case growth in mid-September that didn’t show up in a reduced death rate three weeks later, but perhaps it was too small and short-lived to be meaningful.
The bad news here is that if you ignore the blips, cases started a steady rise on September 29. Today is three weeks later. Are we about to see a steady rise in the death rate too?


