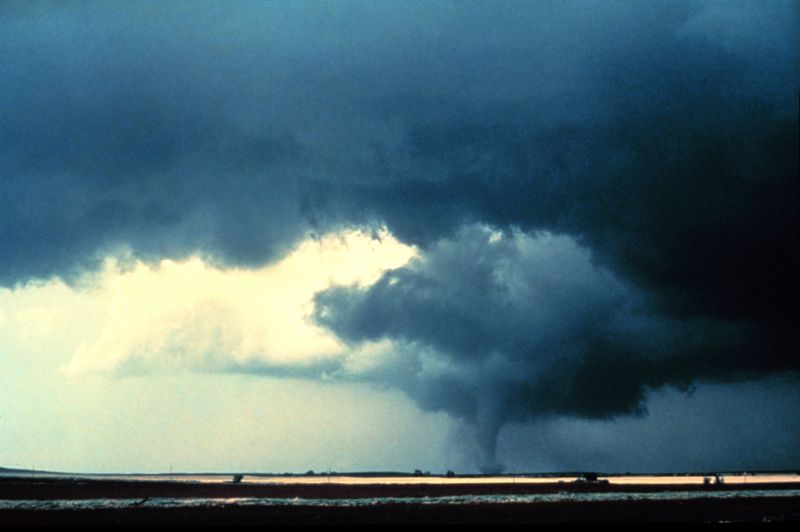
Credit: <a href="http://www.photolib.noaa.gov/htmls/nssl0073.htm">NOAA</a>.
Tornado costs are rising—in lives, so far, more than 500, in costs, so far… well, Scientific American reports on a different kind of ground-breaking:
Sunday’s tornado [in Joplin] also thrusts the insurance industry toward a potential record-breaking year for thunderstorm-related damage. Inland storm claims over the last three years have risen to about $30 billion altogether. That accounts for almost one-third of all the thunderstorm damage going back to 1990, amounting to $97.8 billion, according to the Insurance Information Institute. This year will add billions more onto that tally.
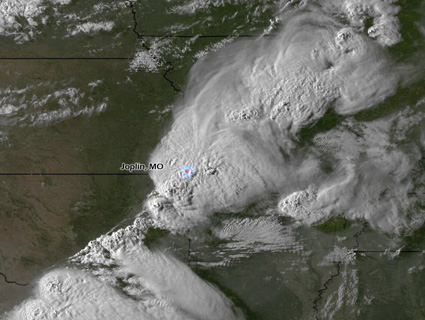
Initial calculations are that Joplin’s whopping EF-5 monster will likely be the costliest single tornado in history—at $1 to 3 billion. I wrote yesterday about how warmer sea surface temperatures in the Gulf Of Mexico are helping fire up the atmospheric war producing these tornadoes.
There are a lot of scary tornado videos out there right now. I appreciate the human silence on this one.
The animation is from NOAA’s Environmental Visualization Lab. It gives a continuous satellite view of tornado activity in April—which spawned more tornadoes than any other month in history: 875 reported; 625 confirmed, so far. Next closest contender was May 2003 with 542 tornadoes.
Most of all, this animation gives me a visceral sense of how scary it is right now living under the gun of weather roulette.
NOAA’s caption:
The animation shows the GOES-East infrared imagery from April 1-30, along with the locations of each tornado that formed during the time (symbolized as red dots). Though tornadoes cannot actually be seen by GOES, these satellites are instrumental in being able to detect the conditions associated with their formation. As the resolution of GOES has increased with each successive satellite series, so have the warning times for tornadoes… The actual tornado locations are acquired from the Storm Prediction Center, which uses both NEXRAD radar and ground reports to generate a detailed database of tornadoes in the U.S.


